
Your Real Estate Expert for Berkeley and Beyond
“Marilyn is exceptional. Her knowledge base, enthusiasm for her job, professional ethics, organization, sensitivity to our aesthetic requirements, loyalty and gentle perseverance set her apart.”
-- Bill and Carol Seidel

Marilyn Garcia, PhD Broker Associate, Realtor® CA DRE LICENSE #01355514
The Grubb Company 1656 Shattuck Avenue Berkeley, CA 94709
Direct: (510) 390-5406
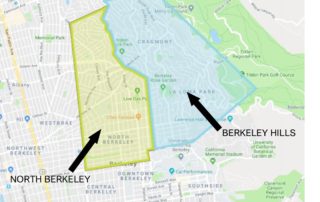
THE OUTLOOK: North Berkeley & the Berkeley Hills, Q4 and full-year 2023 results
THE OUTLOOK: North Berkeley & the Berkeley Hills, Q4 and full-year 2023 results 2023 was an interesting year in Berkeley real estate, where the driving factor was interest rates. Rates climbed to almost 8% during 2023, from around 3% at the start of 2022, with two main effects. On the demand side, higher interest rates reduced demand by increasing costs for any buyer needing to get a loan. To give you a sense of the impact, a loan of $1M at an interest rate of 3% costs $4216/month; at 8%, the monthly payment on that same loan is $3122 more [...]
THE OUTLOOK: North Berkeley & the Berkeley Hills, Q4 and Annual 2022 results
Last year was the craziest roller coaster I’ve ever seen in our local market. We started 2022 with an intense surge in buyer activity, but that surge was reversed by the summer and through the end of the year, as buyers adjusted to higher interest rates, concerns about the economy, and declines in the stock market. *** NORTH BERKELEY: Looking at 2022 as a whole, the median sold price in North Berkeley was $1,650,000, which is unchanged from the previous year. Average sold price per square foot, at $1046, was up 7% compared to 2021. Properties in North Berkeley sold [...]
THE OUTLOOK: North Berkeley & the Berkeley Hills, Annual 2021 & Winter 2021-22 results
It’s time as usual to look at the previous year’s results for our local real estate market, and also talk about the results for the winter season just ended. 2021 started off with a bang. A big upswing in buyer interest led to major competition between buyers, which led to big price increases. The craziness moderated somewhat later in the year as interest rates started increasing and more homes came on the market for sale, but values stayed at the new higher levels. In 2021, there were more properties on the market in both North Berkeley (127 active listings) and [...]
THE OUTLOOK: North Berkeley & Berkeley Hills, Winter 2020-21 wrap-up
As always in the March/April newsletter, I’m going to review both the data for the past year, and also look at the winter quarter results (for December through February). *** 2020 Results: 2020 was a surprisingly solid year in local real estate, despite a big lull in activity with the first shelter-in-place. After just a few weeks, though, real estate was deemed an essential service, and activity gradually picked back up. Berkeley Hills 150 properties sold in the Berkeley hills in 2020, which is a bit fewer than in 2019, but there were also fewer homes on the market. Properties [...]
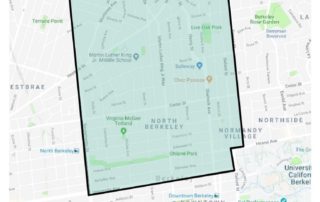
THE OUTLOOK: North Berkeley, Winter 2019-2020 wrap-up
Let’s start with a look back over the previous year in North Berkeley real estate, and then take a quick look forward. Over the course of 2019, there were 89 active listings in North Berkeley, and 81 properties sold. Both of these numbers are down from the previous year, when we had 101 active listings, and 92 sales. Low inventory meant that there were multiple buyers interested in most properties, and 81% of the sales were for more than list price. Sale price averaged 26% above list price for those properties that went over. The median sale price for 2019 [...]
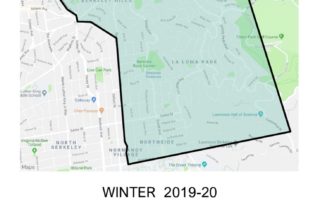
THE OUTLOOK: Berkeley Hills, Winter 2019-20 wrap-up
In Berkeley hills, there were 195 active listings over the course of 2019, and 161 properties sold. 81% of the sales were for more than list price, with multiple buyers interested in most properties, and sale price averaged 20% above list price for those properties that went over. The median sale price for 2019 was $1,425,000, which is up 3% from the previous year. The average sold price per square foot was also up, by 3% from the previous year at $747. Most properties sold quickly, in an average of 20 days on the market. Fourteen properties (8% of the [...]
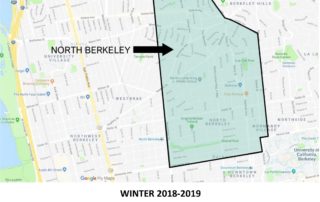
THE OUTLOOK: North Berkeley, Winter 2018-19 wrap-up
The real estate market is constantly in transition -- seasonally, through market cycles, in response to changes in changes in employment and interest rates, and in response to changes in preferences. Over the last handful of years, the North Berkeley market has benefited a lot from increasing demand for properties near BART, shops and restaurants. The market as a whole was somewhat slower than expected in the fall, but overall 2018 was pretty good in North Berkeley real estate. Going into 2019, there is a lot of talk about big upcoming tech IPOs, and the influx of cash and purchasing [...]
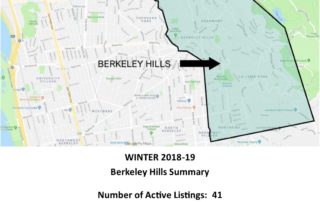
THE OUTLOOK: Berkeley Hills, Winter 2018-19 wrap-up
Towards the end of last year, all the talk was about the real estate market softening, with buyers being more cautious, and a greater supply of listings for sale. Lately, though, the talk is more about big upcoming tech IPOs, and the influx of cash and purchasing power they’re likely to bring to the market. Looking back at the annual data for 2018 in the hills, the median sold price was $1,380,000, which is up 5% from the 2017. The average sold price per square foot was up even more, by 8% from the previous year, at $724. The general [...]
THE OUTLOOK: North Berkeley & the Berkeley Hills, Q4 and full-year 2023 results
THE OUTLOOK: North Berkeley & the Berkeley Hills, Q4 and full-year 2023 results
2023 was an interesting year in Berkeley real estate, where the driving factor was interest rates. Rates climbed to almost 8% during 2023, from around 3% at the start of 2022, with two main effects.
On the demand side, higher interest rates reduced demand by increasing costs for any buyer needing to get a loan. To give you a sense of the impact, a loan of $1M at an interest rate of 3% costs $4216/month; at 8%, the monthly payment on that same loan is $3122 more (or $7338/month).
Demand for homes fell, but, as discussed in previous newsletters, supply was down too, as potential sellers chose to stay put so they could keep their low-interest-rate loans. The number of homes listed for sale in 2023, in both Berkeley as a whole, and in the Berkeley hills specifically, was lower than in any year since before 2000 (which is how far back my personal database extends).
With low inventory offsetting the decrease in demand, the market was slow all year, but there wasn’t big downward pressure on prices. Looking at the data though, 2023 is not going to look as good in comparison to 2022, which had crazy high price results during the upward spike in the first part of that year.
***
North Berkeley, 2023 (full-year) and also Q4 results:
The median sold price in North Berkeley was $1,600,000 for 2023, and the average sold price per square foot was $989. Both figures are down from 2022 (by 3% and 5% respectively). Among the 75 properties that sold in North Berkeley in 2023, only 8 had price changes (all were price reductions rather than increases), and properties sold on average after 23 days on the market. 81% of the sales were above list price.
The market was especially quiet in the 4th quarter (Q4) of 2023. There were only 13 North Berkeley sales, and 9 of those went over list price. The median sold price was $1,420,000 (up 1% from Q4 in 2023), and average sold price per square foot in the 4th quarter was $937 (down 6% from Q4 last year).
***
Berkeley Hills, 2023 (full-year) and also Q4 results:
In the Berkeley hills, the median sold price for 2023 was $1,725,000, with an average sold price per square foot of $867. Both are down from 2022 (by 8% and 9% respectively), but both are a bit higher than in 2021. 113 properties sold in the hills over 2023, and there were only 17 price changes (14 price reductions, and 3 price increases). Properties in the hills sold on average after 23 days on the market, and 80% of the sales were above list price.
Looking at just the 4th quarter (Q4) of 2023, there were only 28 sales in the hills. 21 of those sold for more than their list price. The median sold price for the hills in Q4 was $1,545,000 (up 4% from the 4th quarter of 2022), and average sold price per square foot was $824 (which up 1%).
***
The good news going forward is that interest rates have come down, and might continue to head down over the coming year. Since late October when interest rates peaked at a bit below 8%, they’ve drifted downward into the mid-to-high 6% range. This is still double what rates were in early 2022, but hopefully we are heading in the right direction.
THE OUTLOOK: North Berkeley & the Berkeley Hills, Q4 and Annual 2022 results
Last year was the craziest roller coaster I’ve ever seen in our local market. We started 2022 with an intense surge in buyer activity, but that surge was reversed by the summer and through the end of the year, as buyers adjusted to higher interest rates, concerns about the economy, and declines in the stock market.
***
NORTH BERKELEY:
Looking at 2022 as a whole, the median sold price in North Berkeley was $1,650,000, which is unchanged from the previous year. Average sold price per square foot, at $1046, was up 7% compared to 2021. Properties in North Berkeley sold on average after 19 days on the market, which is pretty typical. Out of a total of 87 sales during the year, only 9 properties had price adjustments before selling (3 were price increases, and 6 were price reductions). 87% of the sales were at prices above list price, and those sold on average for 32% more than list.
The figures for the whole year are of course combining the results from the crazy spring and the much slower latter portion of the year. The fourth quarter data (for October through December 2022) is more indicative of where the market is now. In the fourth quarter, the median sold price for North Berkeley was $1,402,500, which is down 15% from the fourth quarter of the previous year. Average sold price per square foot was $1000, which is also down, but only slightly, by 0.5% compared to the same period in 2021. There was a big change in the number of properties listed for sale during the fourth quarter this year. There were only 20 properties on the market in North Berkeley, compared to 33 during the same period in 2021.
***
BERKELEY HILLS:
In the hills, the median sold price for 2022 as a whole was $1,870,000, which is up 10% from the previous year. Average sold price per square foot was $953, which is also higher, in this case up 11% compared to 2021. Properties in the hills sold on average after 19.6 days on the market, which is the quickest we’ve seen since 2016. There were not a lot of price changes in the hills either. Out of 181 sales, there were only 8 price increases and 7 price reductions. 81% of the sales were at prices above list price, and those sold on average for 33% more than list.
Looking at just the fourth quarter, the median sold price for the hills was $1,661,541, which is down 10% from the fourth quarter of the previous year. Average sold price per square foot was $815, which is also down, but only by 1% compared to the same period in 2021. There were 40 properties on the market in the hills—just under half the number of listings during the same period in 2021.
***
We start 2023 with interest rates about double what they were at the start of 2022. Rates are in the mid-6% range now, and they were in the low 3% range in January 2022. The higher rates have had a big impact on affordability, which reduces demand for properties. Supply though is also lower, because sellers are concerned about market conditions, and they also don’t want to give up existing low-interest loans and borrow at higher rates on a new property.
For people who would be buying their new home without a loan, this is actually a fantastic time to make a move. For those who would be trading a low-interest loan for one with a higher rate, keep in mind that more favorable pricing could more than offset higher interest costs.
THE OUTLOOK: North Berkeley & the Berkeley Hills, Annual 2021 & Winter 2021-22 results
It’s time as usual to look at the previous year’s results for our local real estate market, and also talk about the results for the winter season just ended.
2021 started off with a bang. A big upswing in buyer interest led to major competition between buyers, which led to big price increases. The craziness moderated somewhat later in the year as interest rates started increasing and more homes came on the market for sale, but values stayed at the new higher levels.
In 2021, there were more properties on the market in both North Berkeley (127 active listings) and in the Berkeley hills (272 active listings) than we’ve seen for years, but it was still not enough inventory for all the interested buyers.
****
NORTH BERKELEY
115 North Berkeley properties sold over the year, and 79% of the sales were for more than list price. List prices have not increased as much as values have, so all last year (and continuing now) we saw even more serious overbidding than is typical for this area. For the properties that sold over list price, the average was 30% over, but more than 50% above list was not uncommon. Some Berkeley properties sold as high as double the list price.
The median sold price for 2021 in North Berkeley was $1,650,000, which was an increase of 22% over 2020. Sold price per square foot, at $984 per square foot, was 11% higher than the previous year.
The winter season just ended (December 2021 through the end of February 2022) was very similar to the start of last year, with intense buyer interest. Inventory was back to its usual low level (there were only 18 active listings, and 17 sales for the 3 months), but buyers again seemed extra motivated and there were some epic bidding wars.
The median sold price for the winter season was $1,550,000. This figure is lower than for 2021 because more small properties sold, but it is 30% higher than last winter. The average sold price per square foot from December to February was a whopping $1091, which is up 10% from the fall, and up 29% compared to last winter.
****
BERKELEY HILLS
234 properties sold in the hills during 2021. 52% of them sold above list price, by 25% over on average, but again, far far greater overbids (by $1 million or more) were also happening.
The median sold price in 2021 for the Berkeley hills was $1,700,000, which was an increase of 13% over 2020. Average sold price per square foot, at $861 per square foot, was 12% higher than the previous year.
For this past winter season (December 2021 through the end of February 2022), inventory was low (there were 44 active listings, and 38 sales for the 3 months), but buyer interest was intense. The median sold price for the winter season was $1,925,000, which is 24% higher than last winter. The average sold price per square foot was $899, which is up 11% from the fall, and up 12% compared to last winter.
****
So far spring, 2022 is looking like more of the same. Inventory is picking up somewhat, but the prospect of higher interest rates to come (because of higher inflation) is keeping buyers motivated and the competition for available properties very high.
THE OUTLOOK: North Berkeley & Berkeley Hills, Winter 2020-21 wrap-up
As always in the March/April newsletter, I’m going to review both the data for the past year, and also look at the winter quarter results (for December through February).
***
2020 Results:
2020 was a surprisingly solid year in local real estate, despite a big lull in activity with the first shelter-in-place. After just a few weeks, though, real estate was deemed an essential service, and activity gradually picked back up.
Berkeley Hills
150 properties sold in the Berkeley hills in 2020, which is a bit fewer than in 2019, but there were also fewer homes on the market. Properties sold in an average of 22 days (excluding the Spring Mansion at 1960 San Antonio, which was on the market for 1340 days). The median sold price in the hills was $1,500,000 for 2020, which is up 5.3% from the previous year. 70% of the sales were for more than list price, and those averaged 14% over list. The average sold price per square foot was $770, which is up 3% from 2019.
North Berkeley
A total of 88 properties sold in North Berkeley in 2020, in an average of 18 days on the market. This is more sales, with less time on the market, compared to the previous year. The median sold price in North Berkeley was $1,350,000, which is unchanged from 2019. More than 3/4 of the sales in 2020 were for more than list price, and those averaged 22% over list. The average sold price per square foot was $890, which is up 1.8% from 2019.
***
Winter Results (December 1, 2020 – February 28, 2021):
Berkeley Hills
The median sold price in the hills over the winter quarter was $1,547,500, which is up slightly (0.8%) from the fall and more significantly (by 9.8%) from last winter.
North Berkeley
There were very few sales in North Berkeley over the winter (only 8), so the data is heavily influenced by the characteristics of the properties that sold. 3 of the 8 sales over the winter were small (relatively inexpensive) condos. One of those condos was also a below-market-rate unit (BMR), which means that it must be sold for a restricted, pre-set price ($201,815 in this case). Because these small properties made up a big proportion of the sales, the median sold price over the winter was lower, at $1,195,000, which is lower than in either the fall of 2020, or the previous winter. Despite this data point, single family homes have been selling incredibly well so far in 2021, with loads of offers (we got 26 offers on my listing at 1726 Grant) at very high prices.
***
Interest rates have started creeping up a bit recently (to a little over 3% in many cases), but buyer interest remains intense right now, and the results for the spring season should reflect that!
THE OUTLOOK: North Berkeley, Winter 2019-2020 wrap-up
Let’s start with a look back over the previous year in North Berkeley real estate, and then take a quick look forward.
Over the course of 2019, there were 89 active listings in North Berkeley, and 81 properties sold. Both of these numbers are down from the previous year, when we had 101 active listings, and 92 sales. Low inventory meant that there were multiple buyers interested in most properties, and 81% of the sales were for more than list price. Sale price averaged 26% above list price for those properties that went over.
The median sale price for 2019 was $1,350,000 in North Berkeley, which is up 2% from the previous year. The average sold price per square foot was up 4% from the previous year at $874.
Most properties sold quickly, in an average of 21 days on the market. Twelve properties (15% of the total) did need to adjust their prices before selling—8 properties had price reductions, and 4 properties had price increases. Remember that in our market, a price change in either direction is generally a signal that a property did not get the initial interest that was expected. In 2018, 9 properties had price changes, or 10% of the total sales.
All of these numbers feel consistent with where we seem to be in the real estate market cycle. I think we’re right around the peak, so we’re seeing relatively modest price increases and a few more properties not doing as well as expected.
For the winter quarter just past (December through February), there were only 15 active listings, and 10 sales. 2 properties had price changes, and the median sold price was $1,387,500, up 4% from the fall quarter. The average sold price per square foot was $830 for the winter, which is down 2% from the fall, but up 5% from the previous winter.
So far in 2020, the buyers have been out in droves, looking at the very few houses on the market. Will the coronavirus slow things down going forward? Low interest rates will help, but uncertainty about the economy, and a focus on staying home rather than going to public gatherings (like open houses) could affect buyers’ plans. We’ll have to wait and see how it all develops.
UPDATE, March 20, 2020
Well, since I wrote the post above, things have definitely changed. We now have a statewide Shelter-In-Place order, which has slowed (but surprisingly, not stopped) activity in the real estate market. Open houses are canceled, but there are still properties on the market, being shown, and sold, with photos and virtual tours. I’ve been surprised at how many offers properties have been getting under these extraordinary and difficult circumstances.
Also of note: while the Fed has cut interest rates multiple times, and the interest rate on 10-year Treasury notes (which is typically the rate most tied to rates on home loans) has fallen substantially since the beginning of the year, home loan rates have actually risen. Lenders reportedly were already struggling to keep up with refinance requests, and these difficulties cannot have been helped by the Shelter-in-Place.
THE OUTLOOK: Berkeley Hills, Winter 2019-20 wrap-up
In Berkeley hills, there were 195 active listings over the course of 2019, and 161 properties sold. 81% of the sales were for more than list price, with multiple buyers interested in most properties, and sale price averaged 20% above list price for those properties that went over.
The median sale price for 2019 was $1,425,000, which is up 3% from the previous year. The average sold price per square foot was also up, by 3% from the previous year at $747.
Most properties sold quickly, in an average of 20 days on the market. Fourteen properties (8% of the total) did need to adjust their prices before selling—9 properties had price reductions, and 5 properties had price increases. (Remember that in our market, a price change in either direction is generally a signal that a property did not get the initial interest that was expected.)
All of these numbers feel very consistent with where we seem to be in the real estate market cycle. I think we’re right around the peak, so we’re seeing relatively modest price increases and a few properties not doing as well as expected.
For the winter quarter just past (December through February), there were 37 active listings, and 30 sales. 5 properties had price changes, and the median sold price was $1,410,000, which is about the same as in the fall, but 10% higher than the previous winter. The average sold price per square foot was $723 over the winter, down 1% from the fall, and also down 8% from winter 2018.
So far in 2020, the dry sunny weather has the buyers out in droves, looking at the very few houses on the market. Will the coronavirus slow things down going forward? Low interest rates will help, but uncertainty about the economy, and a focus on staying home rather than going to public gatherings (like open houses) could affect buyers’ plans. We’ll have to wait and see how it all develops.
UPDATE, March 20, 2020
Since I wrote the post above, things have definitely changed. We now have a statewide Shelter-In-Place order, which has slowed (but surprisingly, not stopped) activity in the real estate market. Open houses are canceled, but there are still properties on the market, being shown, and sold, with photos and virtual tours. I’ve been surprised at how many offers properties have been getting under these extraordinary and difficult circumstances.
Also of note: while the Fed has cut interest rates multiple times, and the interest rate on 10-year Treasury notes (which is typically the rate most tied to rates on home loans) has fallen substantially since the beginning of the year, home loan rates have actually risen. Lenders reportedly were already struggling to keep up with refinance requests, and these difficulties cannot have been helped by the Shelter-in-Place.
THE OUTLOOK: North Berkeley, Winter 2018-19 wrap-up
The real estate market is constantly in transition — seasonally, through market cycles, in response to changes in changes in employment and interest rates, and in response to changes in preferences. Over the last handful of years, the North Berkeley market has benefited a lot from increasing demand for properties near BART, shops and restaurants. The market as a whole was somewhat slower than expected in the fall, but overall 2018 was pretty good in North Berkeley real estate. Going into 2019, there is a lot of talk about big upcoming tech IPOs, and the influx of cash and purchasing power they could bring to the market. I have seen articles saying that the number of people who are likely to be affected by the IPOs is not large enough to have a big impact on the market. That might be true, but one of the biggest movers of the market is sentiment — if people think the IPOs will push up prices, buyers will offer more to compete, and it will end up increasing prices.
Looking back at the annual data for 2018 in North Berkeley, the median sold price was $1,327,500, which is up less than 1% from 2017. The average sold price per square foot was up a good bit more, by 9% from the previous year, at $840. There were a few more active listings: 101 in 2018, compared to 97 in 2017. The number of sales was almost identical, with 92 sales in 2018, compared to 91 in 2017. Properties spent less time on the market in 2018 — things sold in only 17 days on average. Overall, not bad.
The real question is, what’s going to happen this year, in 2019? Looking at winter quarter sales (December 2018 – February 2019) is not a perfect market indicator, because winter season is the slowest time of the year, but there is some information there.
Over the winter, the median sold price in North Berkeley was $1,115,000. This is a good bit lower than the median for 2018 as a whole, and it’s down by 18% from the previous winter. The average sold price per square foot ($789) was down 3% from the fall season (this is not unusual for the slow winter season), but (here’s the good news) is up 14% from the previous winter.
This winter we had more sales of smaller homes compared to last winter, and smaller homes tend to sell for lower prices, but for more per square foot. The average size of the sold properties this winter was only 1598 square feet, compared to 2174 last winter. This winter, 2/3 of the sales went over list price.
Overall, the winter results weren’t bad, and so far this spring, the local market is looking quite solid. We’ll have to wait to see how much of that IPO money ends up in Berkeley (and how much other buyers factor in that possibility) as the year progresses.
THE OUTLOOK: Berkeley Hills, Winter 2018-19 wrap-up
Towards the end of last year, all the talk was about the real estate market softening, with buyers being more cautious, and a greater supply of listings for sale. Lately, though, the talk is more about big upcoming tech IPOs, and the influx of cash and purchasing power they’re likely to bring to the market.
Looking back at the annual data for 2018 in the hills, the median sold price was $1,380,000, which is up 5% from the 2017. The average sold price per square foot was up even more, by 8% from the previous year, at $724.
The general talk about the market wasn’t wrong, though. There were a few more active properties — 205 in 2018, compared to 197 in 2017 — and somewhat fewer sales —167 compared to 179 in 2017. The amount of time that properties spent on the market in 2018 was the same as the previous year, about 3 weeks on average. Overall, 2018 was a good year for the local real estate market, but not quite as hot as the last few years.
The real question is, what’s going to happen this year, in 2019? Looking at winter quarter sales (December 2018 – February 2019) is not a perfect market indicator, because the winter season is the slowest time of the year, but there is some information there.
Over the winter, the median sold price in the Berkeley hills was $1,283,000. This is a good bit lower than the median for 2018 as a whole, and it’s also down by 6% from the fall, and by 7% from the previous winter. However, looking further at the data is reassuring, because the average sold price per square foot ($784) was up from both the fall season (by 9%), and from the previous winter (by 21%). Reconciling these two bits of information (median sold price down, average price per square foot up) is the fact that this winter season had more sales of smaller homes. The average square footage of the sold properties this winter was only 1957, compared to 2229 last winter. Smaller homes tend to sell for lower prices, but for more per square foot.
Overall, this winter wasn’t bad, and so far this spring, the local market continues to be quite solid. We’ll see how much of that IPO money ends up in Berkeley as the year progresses.
Your Real Estate Expert for Berkeley and Beyond
“Marilyn is exceptional. Her knowledge base, enthusiasm for her job, professional ethics, organization, sensitivity to our aesthetic requirements, loyalty and gentle perseverance set her apart.”
-- Bill and Carol Seidel
Marilyn Garcia, PhD Broker Associate, Realtor® CA DRE LICENSE #01355514
The Grubb Company 1656 Shattuck Avenue Berkeley, CA 94709
Direct: (510) 390-5406