
Changes Afoot!
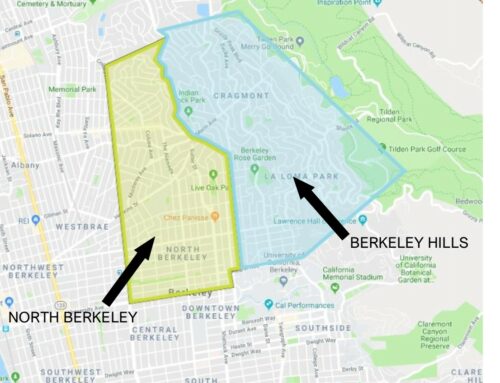
My 20-year anniversary in real estate has inspired me to look over my work systems and find ways to improve going forward. One area that I have re-vamped is the way I collect and analyze local market data. My goal has been to reformat my ongoing database to make it easier to create charts and graphs. I’m also going to start saving data for Berkeley as a whole, in addition to data for North Berkeley and the Berkeley hills.
Another change: In the past, I have looked at real estate “seasons” that correspond with the level of activity we see in the local market. The winter season was defined as December through February, corresponding to the slowest time of the year in our market, and spring (March through May) corresponds with the busiest. Going forward, I am going to instead focus on quarters as traditionally defined. So instead of winter (December, January, February), I’ll track and discuss Quarter 1 (January, February, March), and so on. Since real estate transactions take weeks to close, roughly half the properties that go into escrow in one month close (and show up in the sale data) the following month. This means that switching to quarters won’t make a big difference conceptually, and there are benefits to using quarters in terms of chartmaking and recordkeeping.