
Your Real Estate Expert for Berkeley and Beyond
“Marilyn is exceptional. Her knowledge base, enthusiasm for her job, professional ethics, organization, sensitivity to our aesthetic requirements, loyalty and gentle perseverance set her apart.”
-- Bill and Carol Seidel

Marilyn Garcia, PhD Broker Associate, Realtor® CA DRE LICENSE #01355514
The Grubb Company 1656 Shattuck Avenue Berkeley, CA 94709
Direct: (510) 390-5406
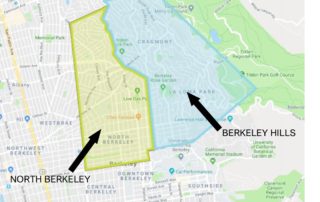
THE OUTLOOK: North Berkeley & the Berkeley Hills, Q1 2024 wrap-up
THE OUTLOOK: North Berkeley & the Berkeley Hills, Q1 2024 wrap-up How is the market doing so far this year? It’s been mixed. Higher interest rates are definitely having an effect. Some properties are selling quickly with multiple offers, and others are not. In general, properties that are well-presented (with good preparation, good staging, and good marketing), and that are strategically priced compared to similar properties, are selling well. There are a good number of first-time buyers in the market, who typically shop for smaller/less expensive homes. There are also wealthy or high-income buyers, who can afford a purchase even [...]

Berkeley is the (among the) best! / Going Green
Best Cities Niche.com recently released its 2024 ranking for the “Best Cities to Live in America,” and Berkeley was #11! Berkeley was rated highly in the categories Public Schools, Good for Families, Nightlife, Diversity, Weather, Health & Fitness, Commute, and Outdoor Activities. Berkeley was bested in this ranking only by Irvine (ranked #6 overall) among California cities. For full details, see niche.com/places-to-live/search/best-cities/. Going Green I am always looking to expand my knowledge of anything related to real estate, and I recently finished the coursework to be a designated “Green” Realtor®. The coursework covered a broad range of topics, from ways [...]
THE OUTLOOK: North Berkeley & the Berkeley Hills, Q4 and full-year 2023 results
THE OUTLOOK: North Berkeley & the Berkeley Hills, Q4 and full-year 2023 results 2023 was an interesting year in Berkeley real estate, where the driving factor was interest rates. Rates climbed to almost 8% during 2023, from around 3% at the start of 2022, with two main effects. On the demand side, higher interest rates reduced demand by increasing costs for any buyer needing to get a loan. To give you a sense of the impact, a loan of $1M at an interest rate of 3% costs $4216/month; at 8%, the monthly payment on that same loan is $3122 more [...]

REAL ESTATE ANSWERS: What counts as a bedroom in real estate, and do more bedrooms add value?
What counts as a bedroom in real estate, and do more bedrooms add value? A bedroom in general is just a room where people sleep. For a room to count as a bedroom for real estate purposes, there are several requirements: (1) FLOOR SIZE. According to the standards used by appraisers, a habitable room must have a floor of at least 70 square feet in area and be at least 7 feet in any direction. So a 7’x10’ room is okay, but a 6’x12’ space, even though it’s 72 square feet, wouldn’t be counted as a room (or a bedroom) [...]

Color of the Year
Color of the Year Design is an important aspect of my job, so I am always interested in color trends. These days, various companies, especially paint companies, annually announce one or more color(s) of the year. You can see a selection of these for 2024 here. (There are lots of interesting blues among them.) The most impactful color of the year is chosen by the Pantone Color Institute, which forecasts global color trends. They have been designating a “color of the year” since 1999, and they were the first to do it. Pantone’s color of 2024 is Peach Fuzz, which [...]
THE OUTLOOK: North Berkeley & the Berkeley Hills, Q3 2023 results
THE OUTLOOK: North Berkeley & the Berkeley Hills, Q3 2023 results The main feature of the Berkeley real estate market in the third quarter of 2023 was the combination of rising interest rates and low inventory of homes for sale. Interest rates on home loans have climbed to the high 7% range, reaching almost 8% as I write this. This is more than double what rates were at the beginning of 2022, so it’s not surprising that we’ve seen a reduction in demand for properties compared to last year. At the same time though, there has been a decline in [...]
REAL ESTATE ANSWERS: How do actions by “the Fed” affect interest rates on home loans?
How do actions by “the Fed” affect interest rates on home loans? The Federal Reserve System (“the Fed”) uses monetary policy to keep the U.S. inflation rate low, and keep the economy operating at full employment. These are competing goals, so their work is a major balancing act. The Fed’s primary policy tool is changes in the federal funds rate, which is the rate at which commercial banks loan extra reserve funds overnight to each other (so it’s a very short-term interest rate). The Fed raises rates to combat inflation, and reduces them if they are trying to fight high [...]

Mobile Driver’s License
Mobile Driver’s License Did you know that the California DMV has a mobile Driver’s License (mDL) pilot program running now, open to up to 1.5 million users? If you’re interested in giving it a try, start by downloading the free app called “CA DMV Wallet” from the Apple App Store, or from Google Play if you have an Android device, and then follow the straightforward instructions there. You create (or log into) your DMV account, enter some basic information, scan your driver’s license, and then “scan” your face (like you’re taking a selfie). Next you submit your request, and wait [...]
THE OUTLOOK: North Berkeley & the Berkeley Hills, Q2 2023 results
Looking at the market data for the second quarter of 2023, the theme seems to be “good news, bad news.” Let’s start with the bad. If you compare price results for the second quarter of this year to the second quarter of 2022, prices are, not surprisingly, down. The median sold price in the hills was $1,725,000 for the second quarter this year, which is down 12% from last year. The average sold price per square foot, $904, is 13% lower than it was for the same period last year. In North Berkeley, the median sold price in the second [...]

REAL ESTATE ANSWERS: What’s going on in the home insurance market, and how does it affect current homeowners?
What’s going on in the home insurance market, and how does it affect current homeowners? In late May, State Farm, which is the largest issuer of homeowners’ policies in California, announced that it would not sell any new home insurance policies in California. In addition, Farmer's Insurance just announced that they will limit the number of new policies they sell here. Allstate also stopped issuing new policies in California last fall, so this is a significant trend. Why are these big insurers pulling away from California at this time? Major wildfires in recent years have resulted in surges in claims, [...]

N11 Refresher
N11 Refresher Here’s a brief refresher on N11 quick-access phone numbers (where N is a number between 2 and 9) . 911 of course connects to a dispatcher for emergency services. Did you know, though, that if you call 911 on a cell phone, the call often ends up in a regional center, and then needs to be forwarded to more local help? If the call needs to be re-routed, this adds time to the process. This is not ideal in an emergency, so it’s a good idea to have your local, direct-access emergency number stored in your cell phone, [...]
THE OUTLOOK: North Berkeley & the Berkeley Hills, Q1 2023 results
A big question on many people’s minds lately is “how is the real estate market doing?” One important answer to that is that inventory has been really low so far this year. There were only 32 listings on the market in the Berkeley hills during the first quarter (Q1) of 2023, which is less than half the number from the same period last year. With so little inventory, there also weren’t many sales. The 15 sales in Q1 this year were also less than half as many as in the first quarter of 2022. In North Berkeley, there were only [...]

More Recycling
More Recycling I started using a new paid recycling service called Ridwell in January, and I have to say, I have been loving it. Ridwell charges $14 to $18 per month (depending on the number of months you commit to), and comes to your house every two weeks to pick up items that our regular City recycling pickups don’t collect. They pick up plastic film (including most bubble wrap, grocery and newspaper bags, and the outer packaging on many items), batteries, light bulbs, and threads (clothing and other fabrics) every time, plus they have one additional special category on each [...]

REAL ESTATE ANSWERS: What is (or was!) the California “Dream For All” program?
What is (or was!) the California “Dream For All” program? There have been many programs over the years aimed at helping first-time buyers get into the expensive California housing market, but they have mostly been so restrictive that few people were able to use them. The less-restrictive “Dream For All” program from the California Housing Finance Agency is targeted to low and moderate income first-time buyers. It provides funds for down payment and closing costs through a shared appreciation loan of up to 20% of the purchase price. Here’s an example of how it can work. A qualifying buyer uses [...]
THE OUTLOOK: North Berkeley & the Berkeley Hills, Q4 and Annual 2022 results
Last year was the craziest roller coaster I’ve ever seen in our local market. We started 2022 with an intense surge in buyer activity, but that surge was reversed by the summer and through the end of the year, as buyers adjusted to higher interest rates, concerns about the economy, and declines in the stock market. *** NORTH BERKELEY: Looking at 2022 as a whole, the median sold price in North Berkeley was $1,650,000, which is unchanged from the previous year. Average sold price per square foot, at $1046, was up 7% compared to 2021. Properties in North Berkeley sold [...]

REAL ESTATE ANSWERS: What design trends are you seeing now for kitchens?
What design trends are you seeing now for kitchens? Here are ten trends for kitchen design I have been seeing in publications and in our local market: Stark all-white kitchens are becoming less popular. People are looking for more warmth, which can come from materials or color. Unpainted wood cabinetry is increasingly popular; the grain and color of the wood add warmth and a natural element to the overall design. If cabinets are painted, we’re seeing less gray and less white, and more shades of blue, green, saffron, and ivory. The use of open shelving for storage is trending downward, [...]

Changes Afoot!
Changes Afoot! My 20-year anniversary in real estate has inspired me to look over my work systems and find ways to improve going forward. One area that I have re-vamped is the way I collect and analyze local market data. My goal has been to reformat my ongoing database to make it easier to create charts and graphs. I’m also going to start saving data for Berkeley as a whole, in addition to data for North Berkeley and the Berkeley hills. Another change: In the past, I have looked at real estate “seasons” that correspond with the level of activity [...]
THE OUTLOOK: North Berkeley & the Berkeley Hills, Summer 2022 results
The real estate market over the summer was noticeably more subdued than in the first half of the year. Buyers were in an absolute frenzy in the spring, anxious to get into the market before interest rates increased, and as a result, prices went up sharply. Over the summer, the spring spike in prices vanished, as buyers became much more cautious. A number of factors together explain why the summer market slowed. The stock market went down (affecting buyers’ down payment funds), and interest rates went up (affecting affordability). Some buyers could no longer afford the type of home they [...]

It’s been 20 years!
It does not feel like it has been this long, but this October marks twenty years that I have been a full-time realtor in Berkeley. I started in real estate with my salesperson’s license in October 2002, and then completed the additional certifications to get my broker’s license in 2006. It was a hard decision to change careers from academia to real estate (I was previously an economics professor at the University of San Francisco), but real estate is my passion, and I haven’t regretted it. I get to apply my economics background in things like analyzing market conditions, thinking [...]

REAL ESTATE ANSWERS: How has the negotiating environment changed as the market has shifted?
How has the negotiating environment changed as the market has shifted? When the real estate market is at its strongest, there is not a vast amount of negotiation between buyers and sellers. Buyers make strong offers in competition, often waiving the inspection contingency, and many sellers choose to accept the best offer, rather than negotiate and risk de-stabilizing the transaction. When the market is more balanced, there are fewer offers on properties, and buyers may not feel that they have to make their best offer at the start. An accepted offer might also have an inspection contingency, so there may [...]
THE OUTLOOK: North Berkeley & the Berkeley Hills, Spring 2022 results
There has been a lot going on in the real estate market since my last newsletter, when I wrote that competition between buyers was looking especially intense. The prospect of increasing interest rates always motivates buyers to find something before rates go up, so they bid extra hard for available properties. As a result, we saw more incredible sale prices during the spring, and the market reached a new peak. **** NORTH BERKELEY There were 39 properties on the market in North Berkeley over the spring season (March through the end of May), and 27 properties sold. Of these, all [...]

REAL ESTATE ANSWERS: How much difference do higher interest rates make for home sales in our area?
How much difference do higher interest rates make for home sales in our area? Over the spring, the Federal Reserve announced a plan for multiple interest rate hikes this year to try to get inflation under control, and we’ve seen three rate increases already this year. As I write this, interest rates on home loans are approaching 6%, up from about 3% at the start of the year. Interest rates are at their highest level in 10 years, and there may be additional increases to come. Increasing rates make a lot of difference in the purchasing power of individual buyers. [...]

Bulky Waste and an E-Waste Resource
Did you know that, as a Berkeley homeowner, you can schedule one free bulky waste pick-up per calendar year? Just call (510) 981-7270 to schedule for an upcoming Wednesday. They’ll pick up a maximum of 3 cubic yards, which they say is the equivalent of about 20 large trash bags. Everything they pick up goes to the landfill, so be sure to separate out recyclables, green waste, and consider Urban Ore for items that can be re-used. Some things are not eligible for the bulky waste pick up. Included on the “not OK” list are things like hazardous waste items, [...]
THE OUTLOOK: North Berkeley & the Berkeley Hills, Annual 2021 & Winter 2021-22 results
It’s time as usual to look at the previous year’s results for our local real estate market, and also talk about the results for the winter season just ended. 2021 started off with a bang. A big upswing in buyer interest led to major competition between buyers, which led to big price increases. The craziness moderated somewhat later in the year as interest rates started increasing and more homes came on the market for sale, but values stayed at the new higher levels. In 2021, there were more properties on the market in both North Berkeley (127 active listings) and [...]
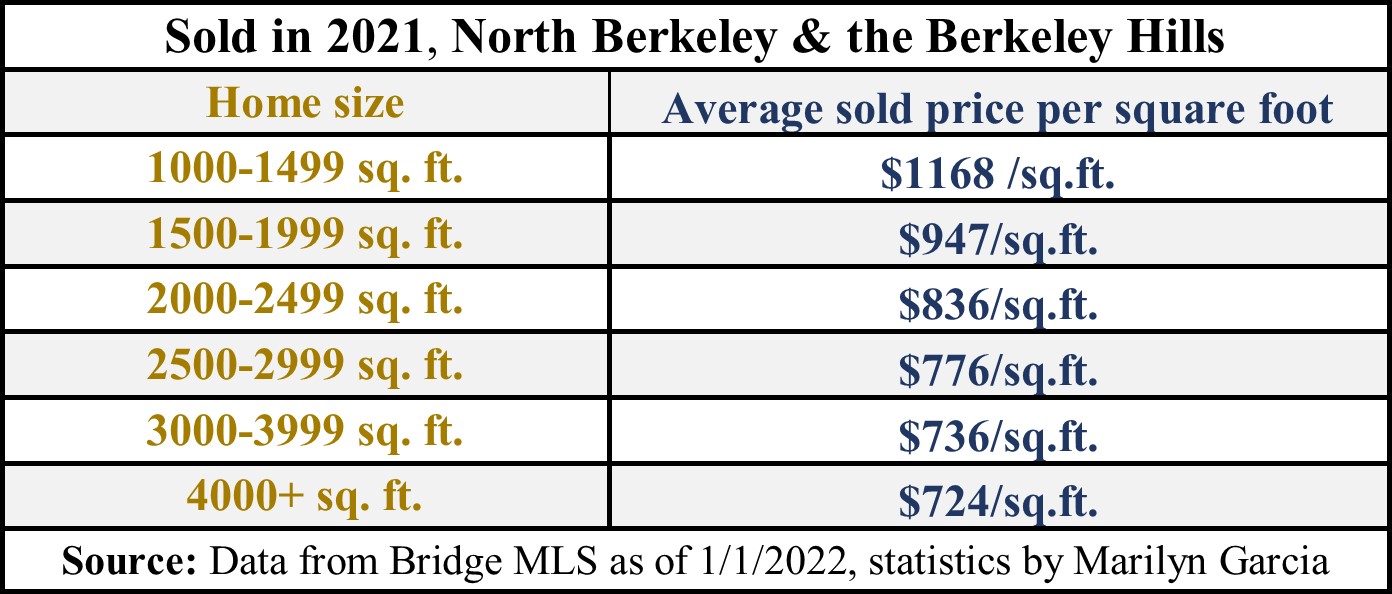
Variations in Sold Price per Square Foot
If you are a regular reader of this newsletter, you have many times encountered the notion that, everything else being equal, the amount a property sells for per square foot of living space tends to be lower for large homes, and higher for small homes. To illustrate this point, I grouped the detached homes sold in North Berkeley and the Berkeley hills* over the course of 2021 by size category, and found the average sold price per square foot for each category. The results are above. As you can see, the pattern holds as a general rule: the larger the [...]

REAL ESTATE ANSWERS: Why are most sellers in our area no longer accepting “love letters” from buyers?
Why are most sellers in our area no longer accepting “love letters” from buyers? In our market, where buying a home is a super-competitive process, it used to be the case that buyers would include a “love letter” with their offer in hopes that it would influence the seller in their favor. The letter would tell the seller about the buyers, their qualifications, and why this property would be the perfect home for them. It also often included a photo of the buyers. The idea was that, because many (even most) sellers have some emotional attachment to the property they’re [...]
THE OUTLOOK: North Berkeley & Berkeley Hills, Fall 2021 results
I mentioned in the last newsletter that the market seemed to be cooling off a bit from the spring frenzy, and that was true through most of the fall season. That has changed recently (the market has been crazy hot again in December!), but we won’t have data on that until next year, when the currently pending sales have closed escrow. Over the fall, inventory was relatively high, and it was the competition between properties that made the market a little cooler than earlier in the year. Prices are still sky-high though. Sales over $2 million are now not uncommon [...]

REAL ESTATE ANSWERS: Should I be careful not to over-disclose when I’m selling my home?
Should I be careful not to over-disclose when I’m selling my home? Completing seller disclosure forms in California can be a daunting task. A seller is legally obligated to disclose all known material information about the property to the buyer, and can be sued for hiding defects or problems. A material fact is any piece of information that would affect the buyer’s decision to purchase the property. To meet this obligation, sellers complete a series of detailed questionnaires about the current condition of the property, ongoing maintenance, past repairs and upgrades, and a whole array of other topics. Some of [...]
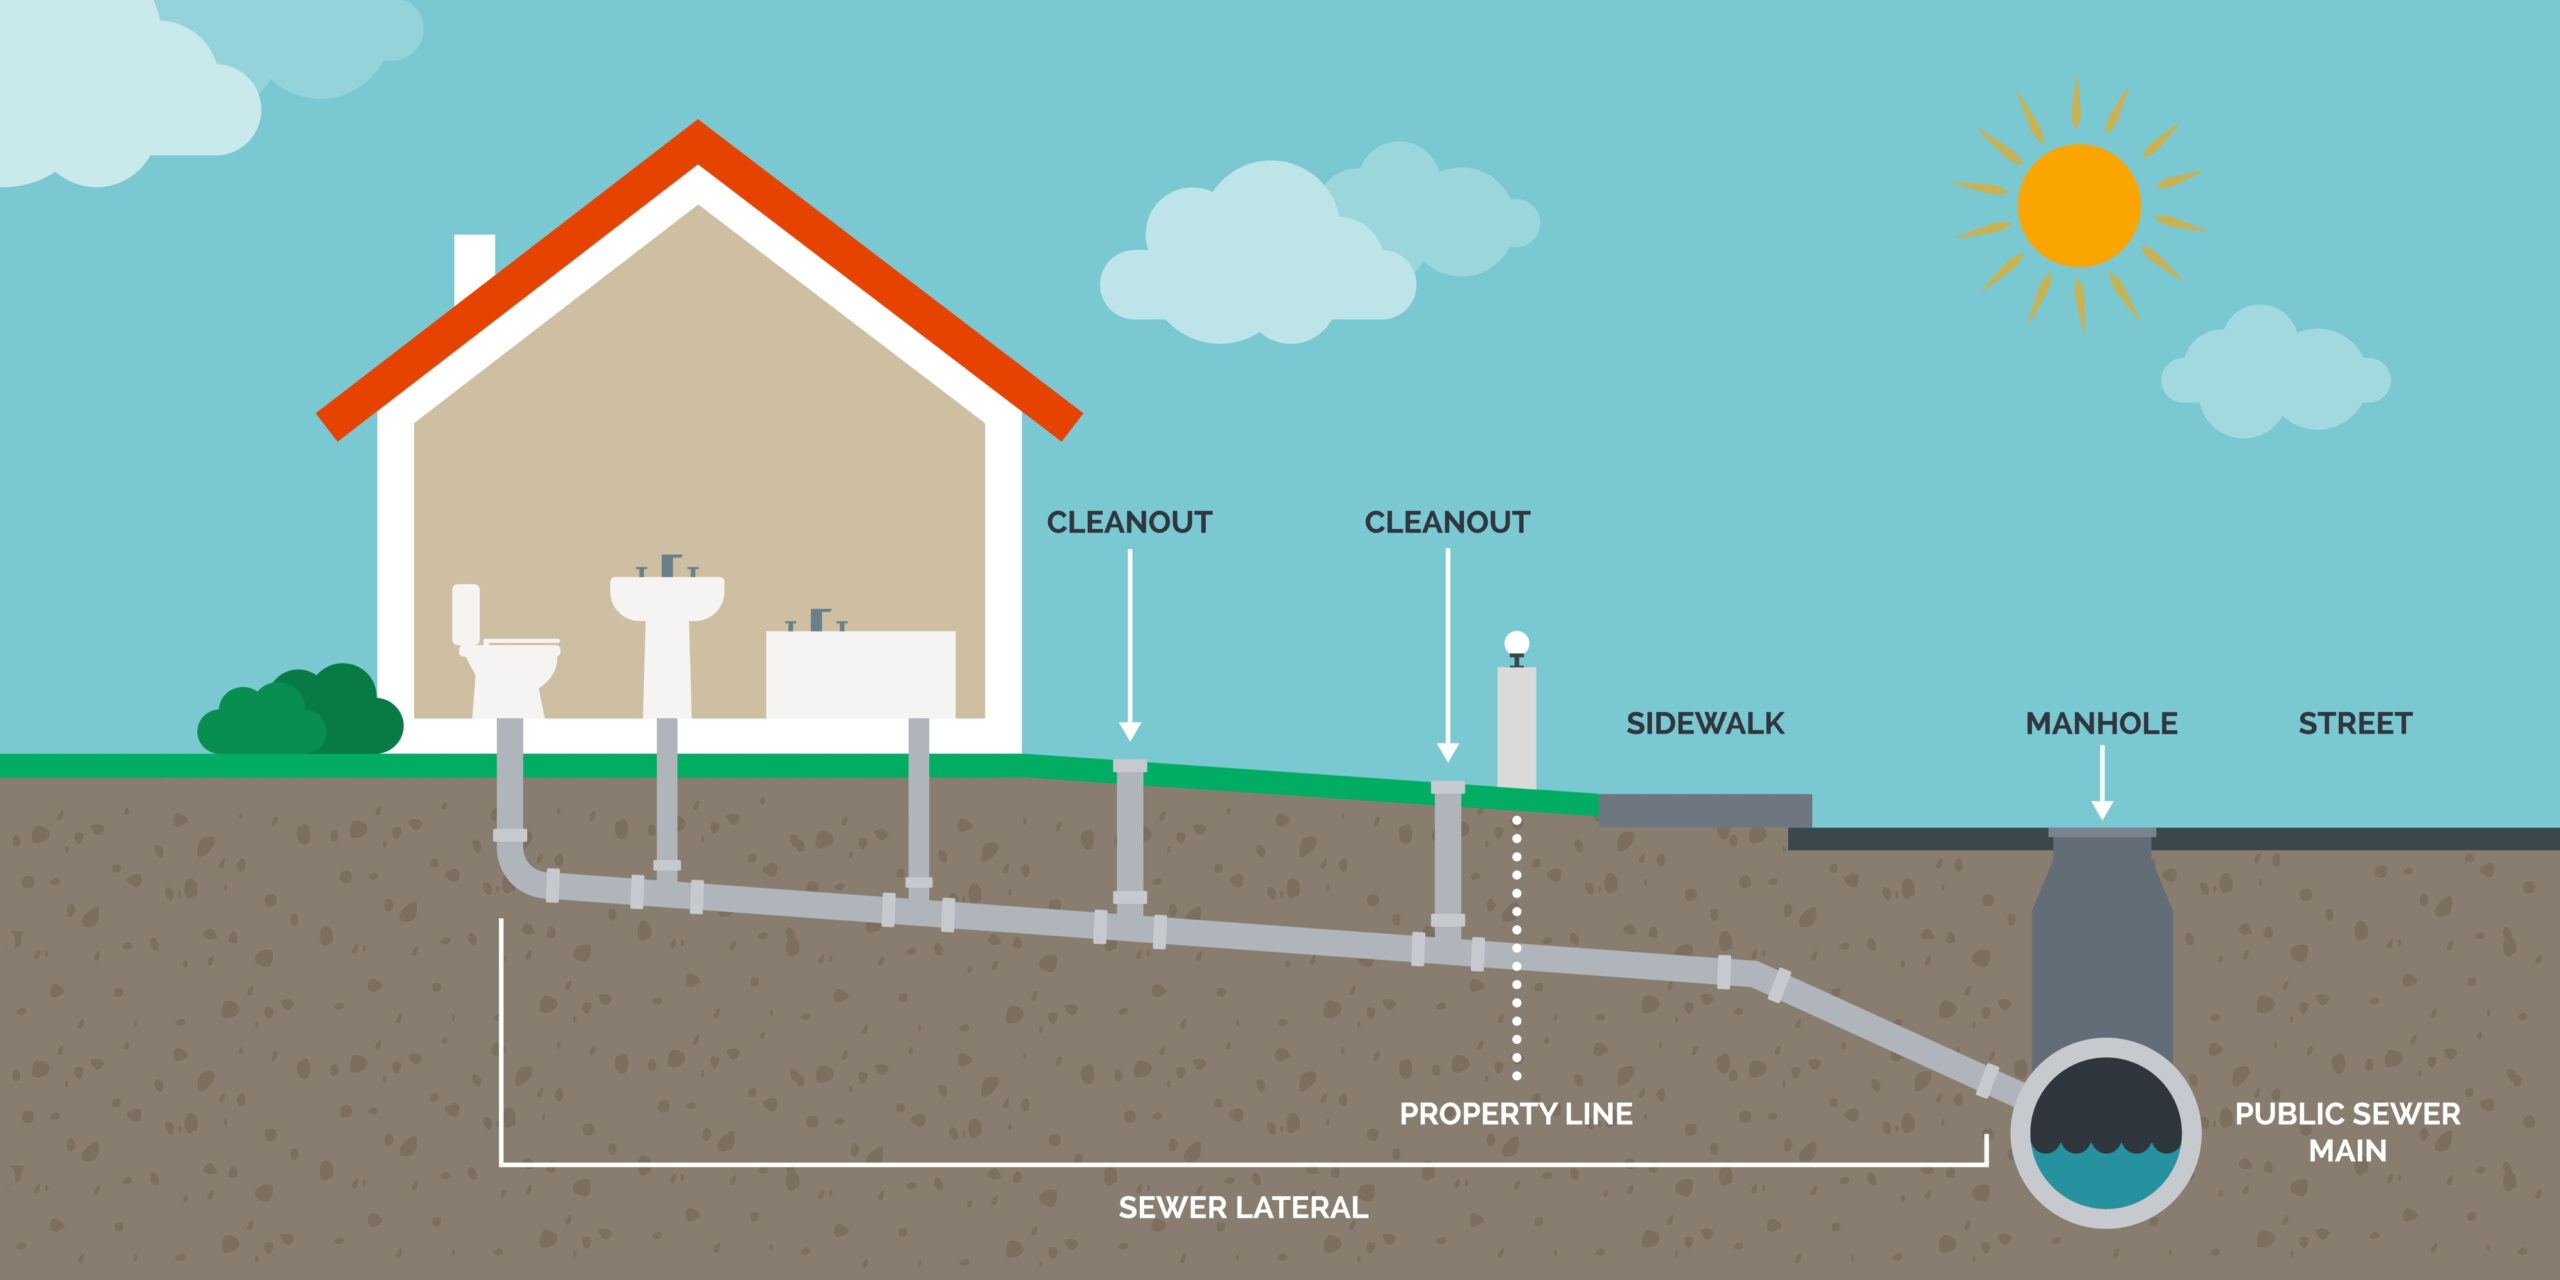
SEWER LATERALS AND DRAINAGE
Sewer Laterals and Drainage We’ve had a number of office discussions about water-related issues since the first “atmospheric river” passed our way, and I heard something about sewer laterals that I wanted to pass along. A sewer lateral is the underground pipe that takes wastewater from your home to the city sewer line. You probably know that when you sell a home in Berkeley, the sewer lateral needs to be brought up to current standards, either before or soon after a sale, unless there is a compliance certificate already on file. The reason this is a requirement is not to [...]
THE OUTLOOK: North Berkeley & Berkeley Hills, Summer 2021 wrap-up
I have been getting lots of questions lately about the state of the market, with people mentioning news articles that cite slowing. Our local market was not quite as crazy over the summer as it was over the spring, and that seems to be continuing into the fall. However, the spring was sooooooo crazy, that even with a little cooling, the market is still very solid. **** BERKELEY HILLS There were 96 active listings in the hills for the summer 2021 season (June through August), and 66 properties closed escrow. These numbers are up from the spring, which is not [...]

RESOURCEFUL
RESOURCEFUL I try to recycle as much as possible, but I pretty frequently find myself staring at something trying to figure out what to do with it. I recently downloaded the “Resourceful” app to my phone, and I really like it! [If a phone app is not your thing, you can get the same information online at ResourcefulApp.com.] On Resourceful, you can look at various products, and see recycling information that is specific to Berkeley, and also ideas for more sustainable alternatives. Resourceful also has a useful general guide to recycling in Berkeley. Here are a few tidbits about [...]

REAL ESTATE ANSWERS: What kinds of projects can add lasting value to my home?
What kinds of projects can add lasting value to my home? Suppose you want to do some work on your home, and you want to choose a project that will add value, not just today, but into the future when you might sell your property. We all know that kitchens and baths sell houses, so remodeling either of those is an obvious possibility. However, if you have a long time horizon, there's a problem with that choice: remodeling is very style-dependent. If you remodel your kitchen now, but don’t sell your home for 15-20 years, you’re not going to get [...]
THE OUTLOOK: North Berkeley & Berkeley Hills, Spring 2021 wrap-up
I am definitely a data-lover (I know that will not come as a surprise!), but I have been especially looking forward to analyzing the data for Spring 2021. The Berkeley market has been super hot since the start of the year, and the spring results are where that should show up. **** BERKELEY HILLS Over the spring season, there were 75 active listings in the hills, and 59 properties sold. These numbers are both higher than for Spring 2020 (not surprisingly, given that was the start of the pandemic shut-downs), and they’re also higher than in Spring 2019. Properties were [...]

A GREAT CAUSE
A GREAT CAUSE Since as far back as I can remember, I have always loved libraries. When I was growing up, I loved the independence of wandering the aisles and choosing my own reading adventures. As a teen, the library was a safe and welcoming place to study and to meet up with friends. In college and graduate school, libraries were places to find answers, and spots of quiet serenity where I could get serious work done. As an adult, I borrow books all the time (although now I do it electronically, which I know is a controversial choice for [...]

REAL ESTATE ANSWERS: What is the right pricing strategy for my home?
What is the right pricing strategy for my home? In Berkeley and in the surrounding areas, it has long been the case that many properties are listed below what they’ll likely sell for. I’ll call this “low pricing.” Low pricing is a strategy intended to attract the attention of a wide range of buyers and to generate multiple offers. Most properties around here follow this strategy, but it’s not the only possibility. “Transparent” pricing is a newer term for the classic pricing strategy followed in most other areas. It refers to choosing a list price that is at a value [...]
THE OUTLOOK: North Berkeley & Berkeley Hills, Winter 2020-21 wrap-up
As always in the March/April newsletter, I’m going to review both the data for the past year, and also look at the winter quarter results (for December through February). *** 2020 Results: 2020 was a surprisingly solid year in local real estate, despite a big lull in activity with the first shelter-in-place. After just a few weeks, though, real estate was deemed an essential service, and activity gradually picked back up. Berkeley Hills 150 properties sold in the Berkeley hills in 2020, which is a bit fewer than in 2019, but there were also fewer homes on the market. Properties [...]
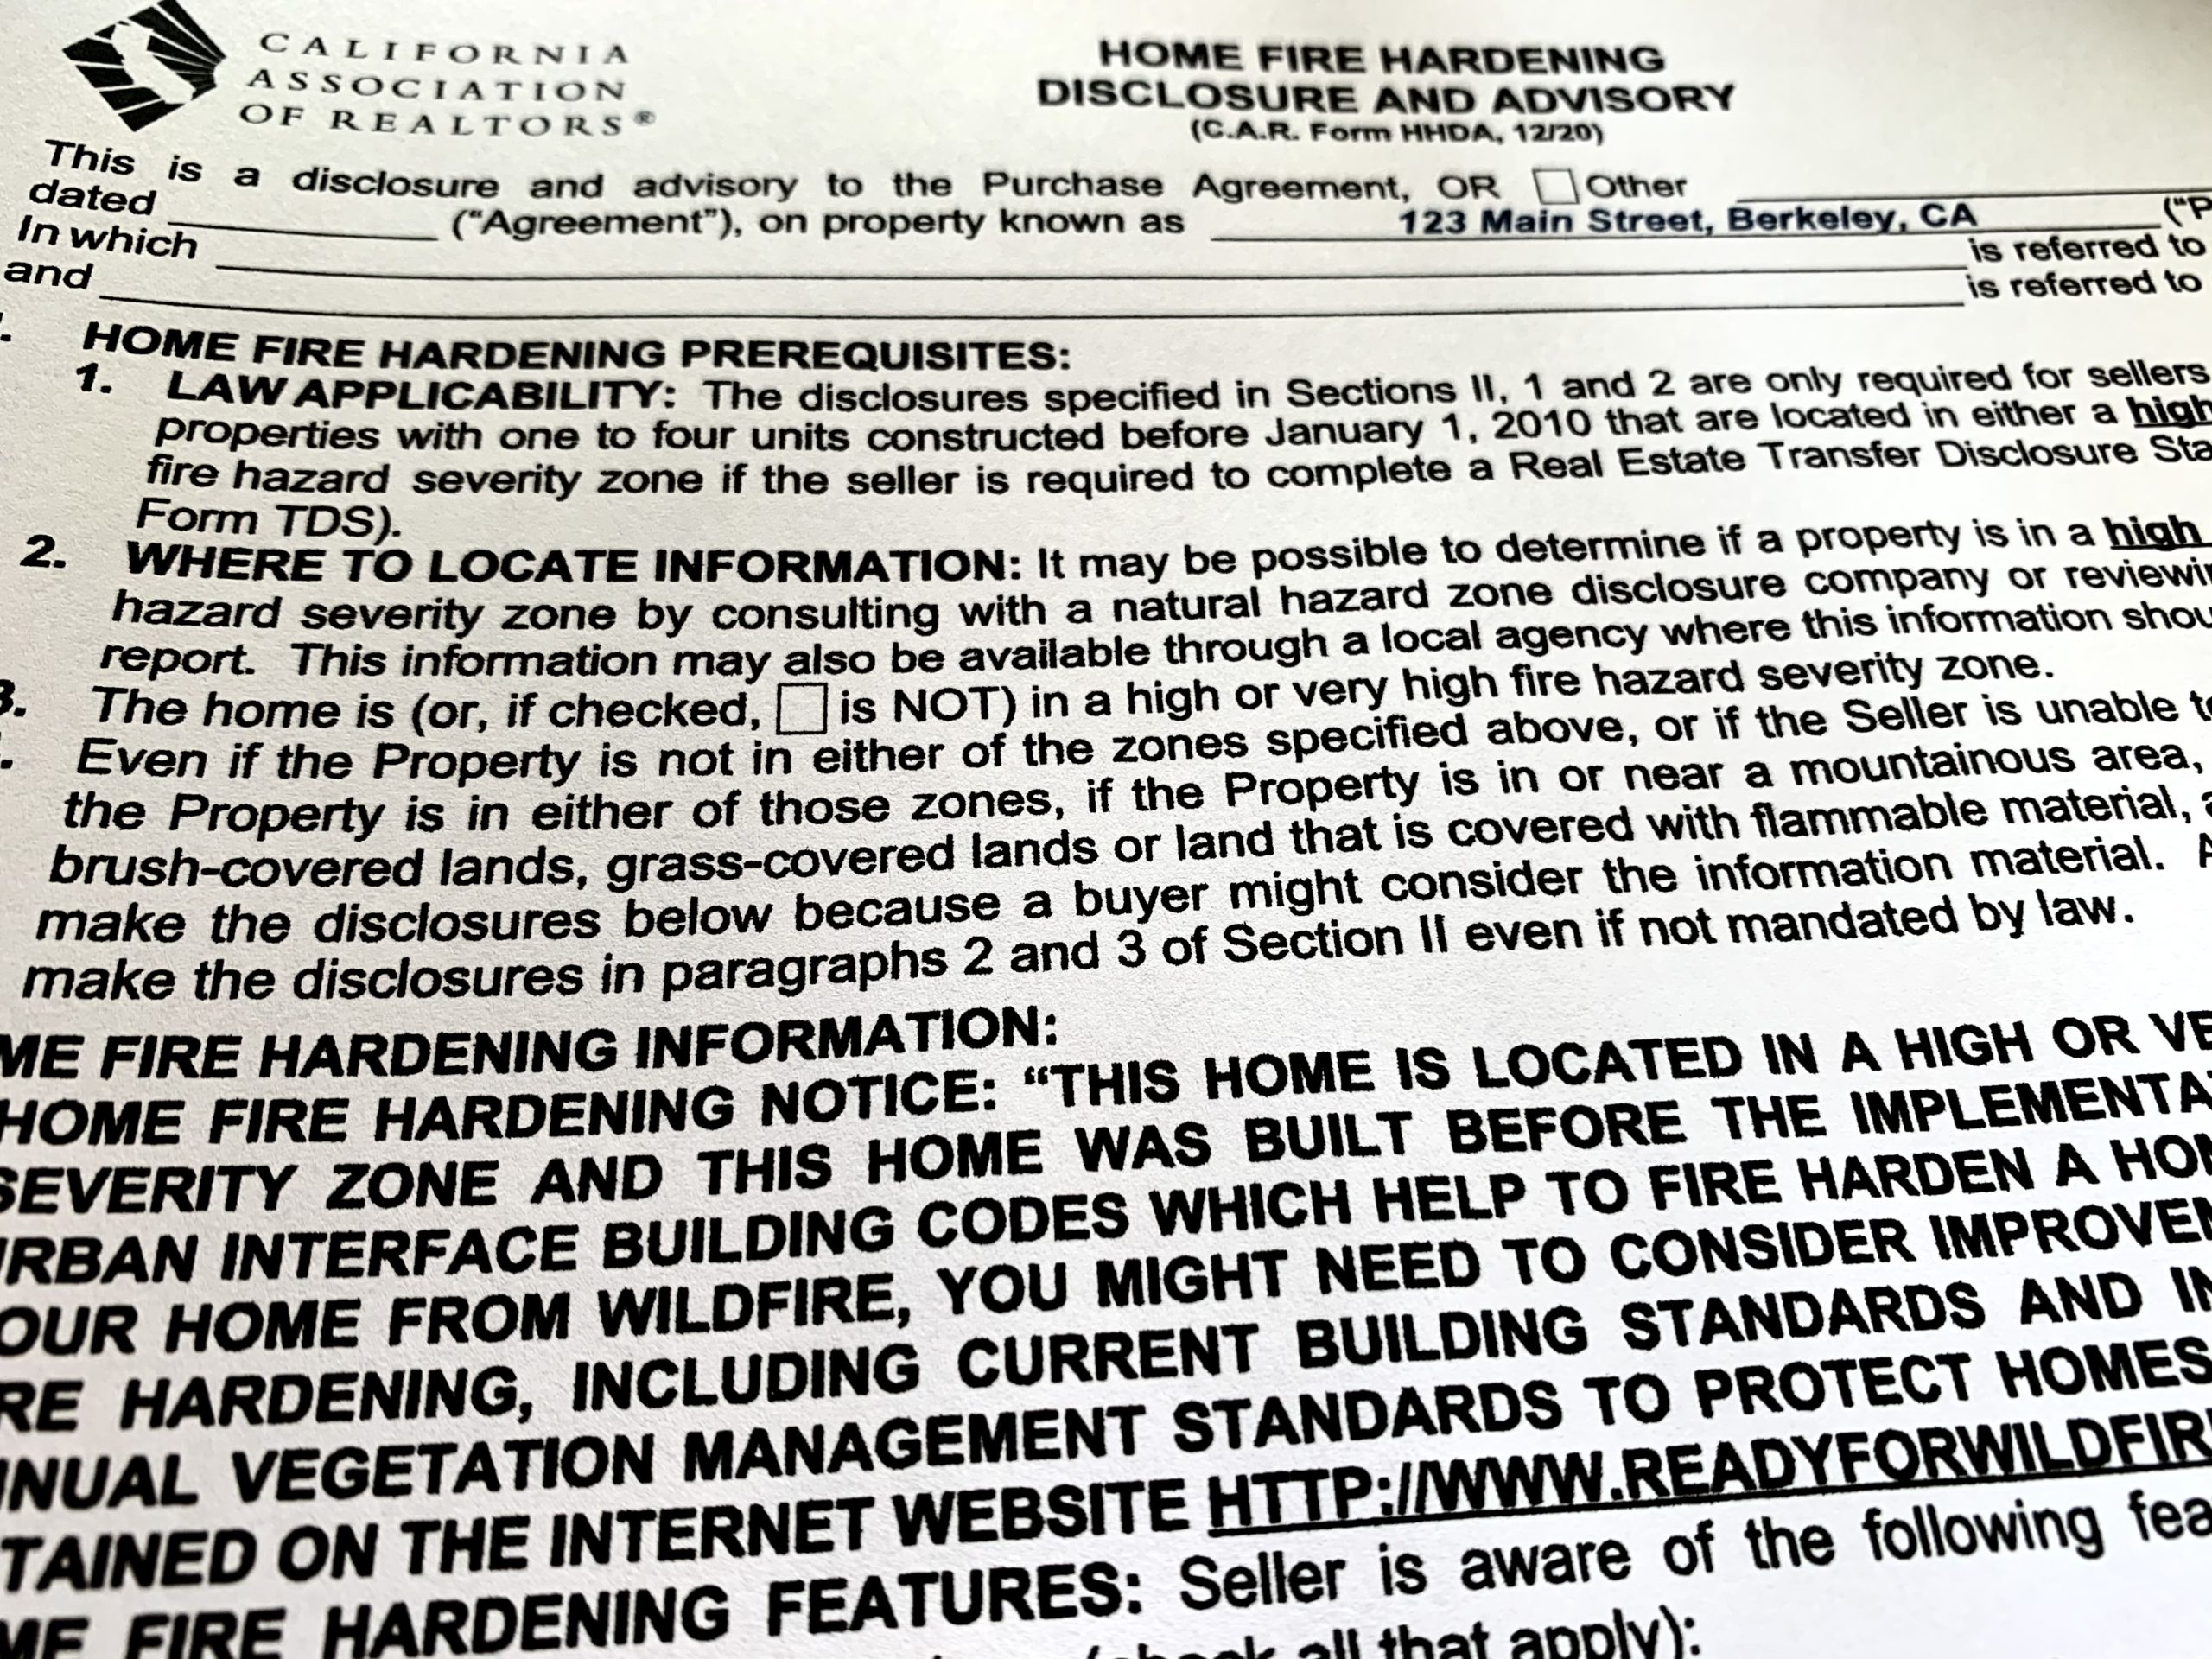
REAL ESTATE ANSWERS: What is home fire hardening, and do I need to do it?
What is home fire hardening, and do I need to do it? “We’ve learned from recent fires. Hardening your home and keeping the 5 feet closest to your house clear of flammable materials (including patio furniture and décor) greatly improves its chance of surviving a fire.” CALIFORNIA FIRE SAFE COUNCIL Fire hardening is making changes to an existing home to make it more resistant to wildfire. According to the Fire Safe Council, your home can catch fire in 3 main ways: from ember storms, where small pieces of burning material are blown in front of a fire (embers can apparently [...]

HOW TO CHOOSE LED BULBS
HOW TO CHOOSE LED BULBS I spend a lot of time looking at light fixtures and choosing bulbs, because replacing light fixtures is one of the most cost-effective ways to create an updated look in a home for sale. Choosing LED bulbs is surprisingly complicated, but here’s the step-by-step process that I use: 1: Figure out what shape bulb you need (including the size of the bulb and the type of socket). 2: Make sure to get bulbs for enclosed fixtures if your fixture is enclosed. 3: Choose the color temperature. (I always go for 2700K, which is like an [...]
THE OUTLOOK: North Berkeley & Berkeley Hills, Fall 2020 wrap-up
I find this sort of amazing given what’s been going on in the world this year, but our real estate market has continued to do remarkably well through the fall season. The combination of super low interest rates and the desire to have a better space to shelter in has kept demand from buyers strong. At the same time, fewer property owners have put their homes on the market — for Berkeley as whole, the number of homes for sale from January through November this year was down 14% compared to the same period last year. With low supply and [...]
LOW RATES & HIGHER CONFORMING LOAN LIMITS
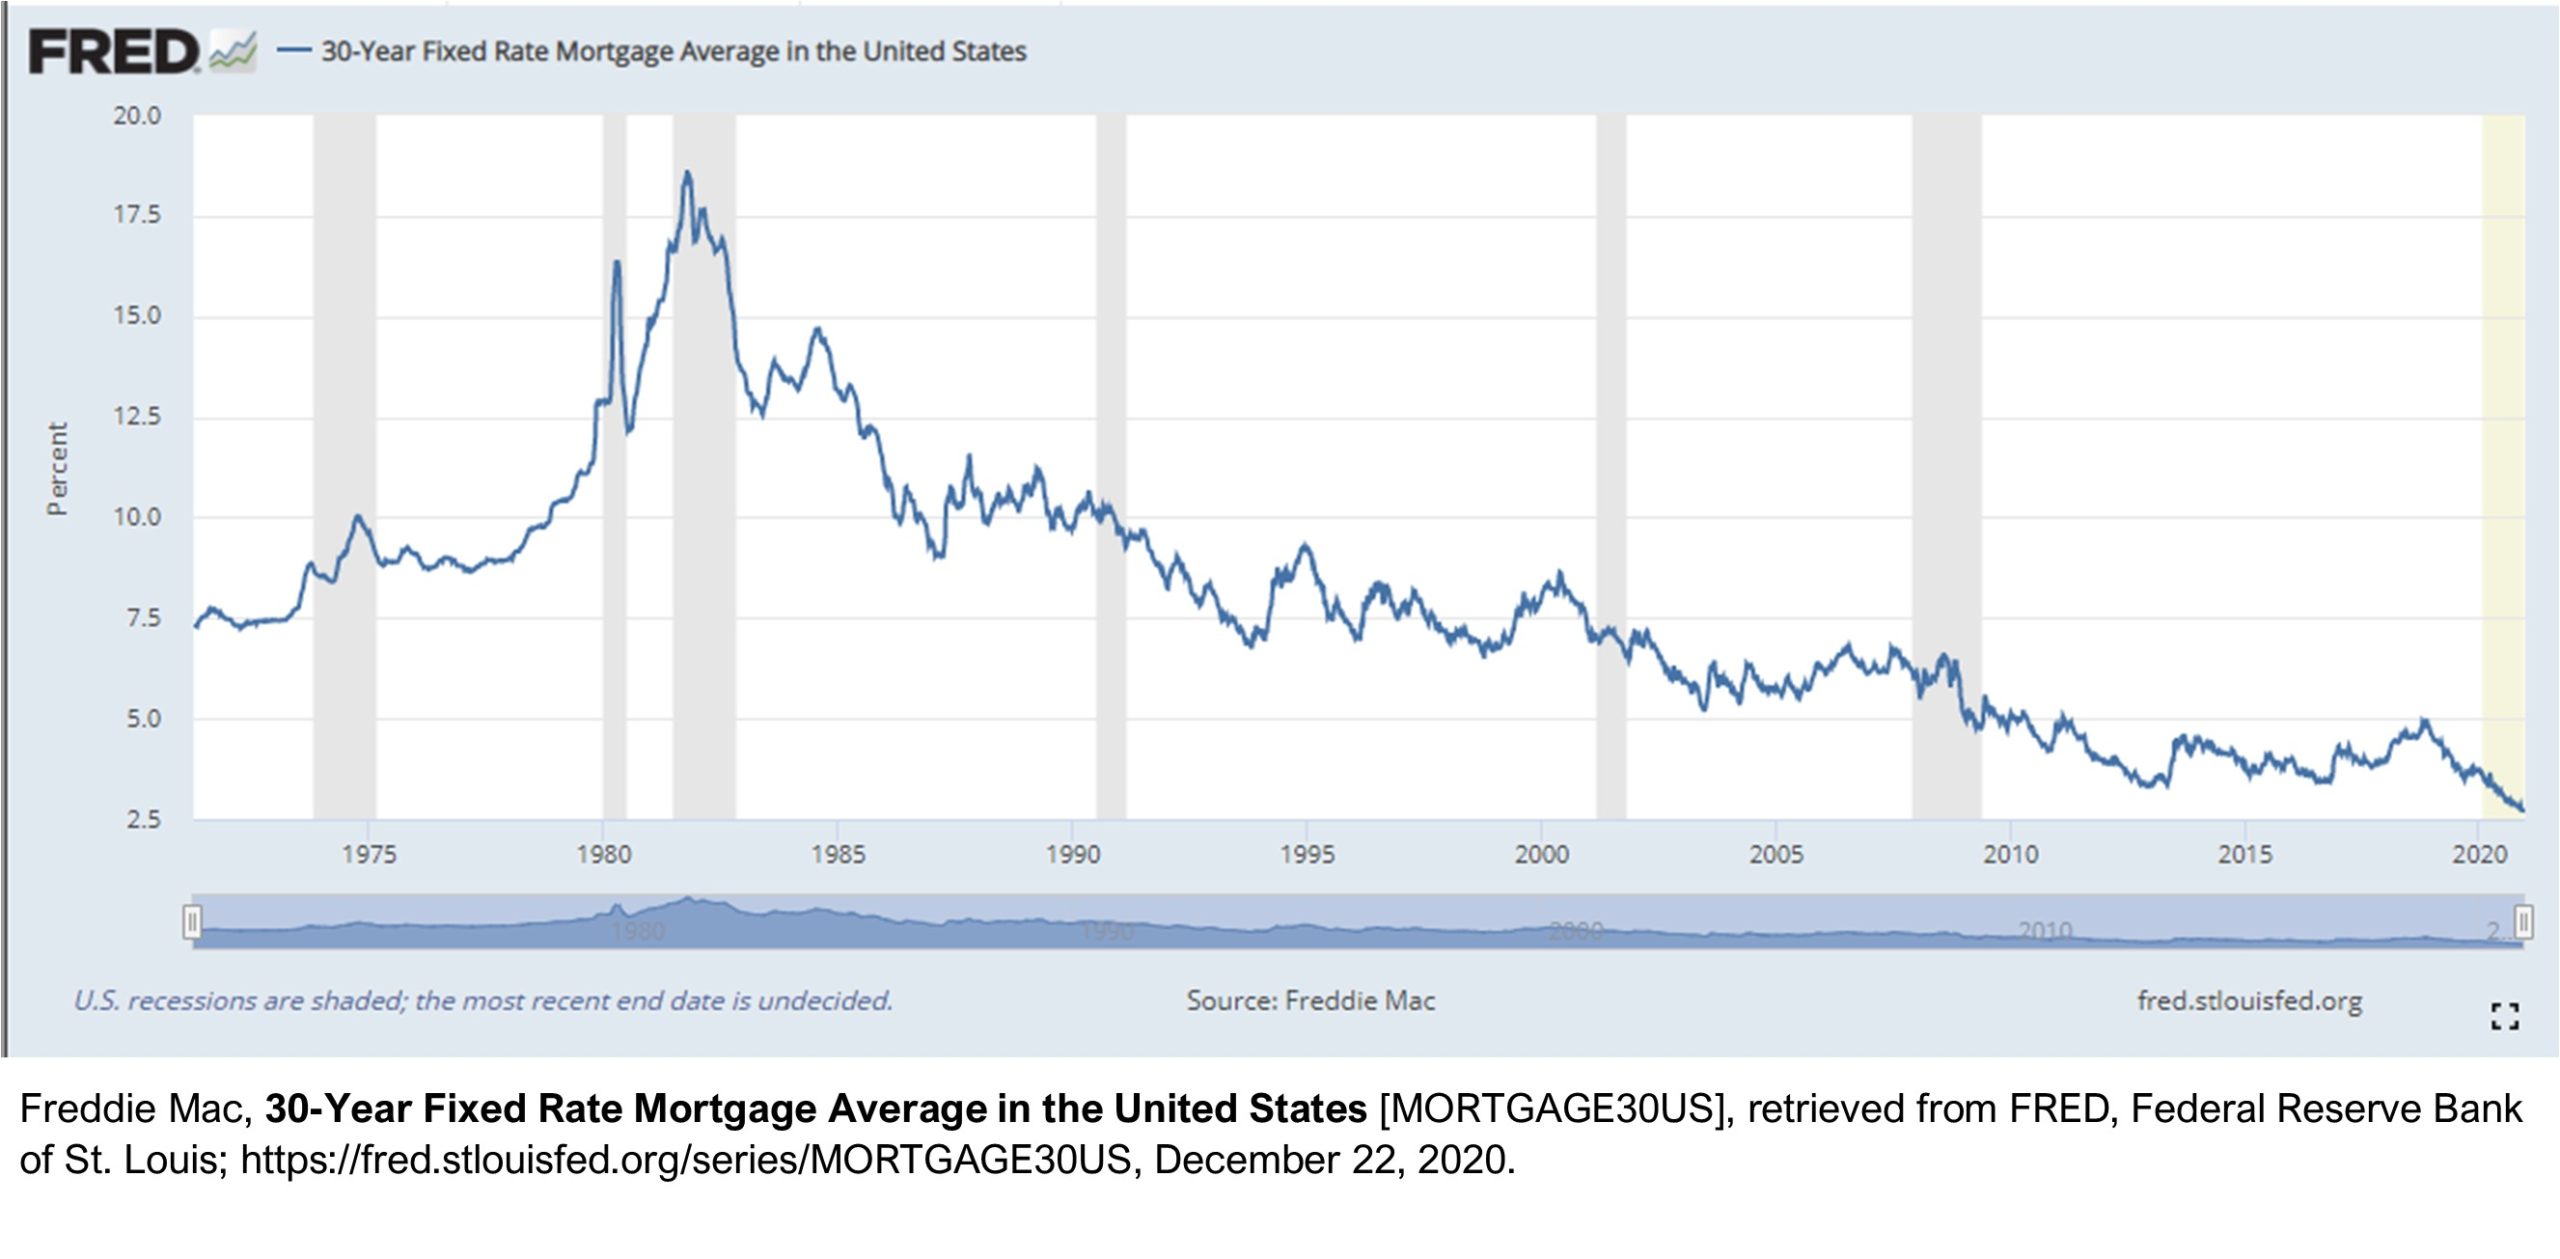
LOW RATES AND HIGHER CONFORMING LOAN LIMITS Interest rates are low, low, low right now! As I write this, the 30-year fixed rate is lower than it’s been since Freddie Mac began tracking mortgage rates in 1971. While it’s not surprising that rates are low given the economic impacts of the pandemic, it is still an opportunity for both buyers getting new loans and homeowners who can refinance their existing loans. Fixed rate 30-year conforming loans (up to the loan limits discussed below) can in many cases be had for under 3%. Even larger-amount jumbo loans, which were challenging to [...]
THE OUTLOOK: Berkeley (North & Hills), Summer 2020 wrap-up
Between the pandemic, the wildfires, and the blanket of smoke we’ve had to live with lately, one would think that the local real estate market would have gone into hibernation, but this has not been the case. The pandemic has caused many people to re-evaluate where they want to live. We’ve been spending much more time in our homes— for work, for school, for meals, for entertainment, for exercise, for leisure— so having the right indoor and outdoor spaces for those activities is more important than ever. Many people working from home are moving to take advantage of lower real [...]

ARE YOU UNDER-INSURED?
ARE YOU UNDER-INSURED? The huge wildfires this year are a reminder that we should all periodically evaluate our insurance coverage, and make sure that we could rebuild if we ever needed to. Most insurance policies auto-renew each year, and the coverage may not keep pace with rising building costs. To get a very rough sense of the adequacy of your existing coverage, take your total coverage amount and divide it by the square footage of your home to calculate how much you would be able to spend per square foot if you had to rebuild. Experts say that $250-$300 per [...]
THE OUTLOOK: Berkeley (North & Hills), Spring 2020 wrap-up
I’m going to shift focus somewhat for this issue of The Outlook. We’re living in a time right now when many of our usual concerns seem trivial. Compared to the importance of the growing calls for an end to systematic racism and violence against black people and reforms in the way we police our communities, and compared to coping with a global pandemic and its effect on our lives and livelihoods, real estate market statistics seem like a side note. However, there are a variety of reasons why people still want to know what’s happening in the local real estate [...]

REAL ESTATE ANSWERS: Why should you pull a permit for work done on your home?
Why should you consider pulling a permit for work done on your home? The #1 reason you should get a permit if you’re having work done on your home that requires it is the obvious one: it’s required by law, and you can have problems with the City if they discover you don’t have a permit, either as the work is being done, or after the fact. That said, it’s definitely the case that many homes in our area have work that was done without permits. Homeowners choose to skip permits for a variety of reasons, including the cost of [...]

Home Loans, Interest rates, and Real Estate Newsletters
HOME LOANS AND INTEREST RATES x Interest rates on home loans have been very low lately! If your interest rate is close to, or above, 4%, it could be worth your while to contact your favorite loan person and see if you could benefit from refinancing your loan. x (See the update below.) Also, the limit on conforming loans (which can be sold to Fannie Mae and Freddie Mac) in our area was increased for 2020 to $765,600, up from $726,525 last year. Loans below that limit often have lower interest rates than those above. UPDATE, March 20, 2020 While [...]

REAL ESTATE ANSWERS: I’m considering selling my home next year. What should I start doing now to get ready?
I’m considering selling my home next year. What should I start doing now to get ready? It’s a well-known fact that right now is not the optimal time to sell a home in our area. It is, however, the right time to start getting things in place if you’re thinking of selling next year, so that you’re ready for the very busy selling season. Here are the first things to do to get ready. (1) Think about where you’ll be when your home is on the market. Do you already have your next home set? Are you renting or buying [...]

Bridge Loans
BRIDGE LOANS Did you know that it’s possible again to get a bridge loan? A bridge loan is a short-term loan that can be used to access the equity in a home you are planning to sell in order to purchase a new home. Following the financial crisis in 2008, lending standards got extremely strict, and bridge loans vanished from the market. Non-cash buyers who wanted to buy a new home before selling their old one needed to either (1) show that they had enough income to make payments on the loans on their existing home and on their new [...]

REAL ESTATE ANSWERS: Why do list prices sometimes increase after a property has been on market for a while?
Why do list prices sometimes increase after a property has been on the market for a while? In most parts of the country, properties come on the market, and if they don’t sell after a period of time, motivated sellers will reduce the list price to attract buyers. Around here, if a property is not getting the interest the seller hoped for, sometimes the seller will reduce the list price, but other times the list price will increase. What’s going on? The answer lies in the strategy that was followed in choosing the original list price. In other areas, the [...]

Emergency Alerts
EMERGENCY ALERTS Have you signed up yet for Alameda County emergency alerts? The system is called AC Alert, and it’s very easy to sign up to receive notifications from city and county agencies in the case of an emergency. Just go to ACalert.org online, and you can sign up to receive notifications by voice message, text message and/or email. The City of Berkeley previously used an alert system called BENS, but this system is no longer active, and subscribers to BENS are not automatically signed up for AC Alert. There are other alert systems that have slightly different focuses. I [...]

REAL ESTATE ANSWERS: How have the massive fires in recent years affected homeowner’s insurance locally?
How have the massive fires in recent years affected homeowner’s insurance locally? I spoke with Ruth Stroup with Farmers Insurance, who is always a great source of information about the insurance world, and asked her what changes she’s seen as a result of the tragic fires we’ve had in California over the last few years. Ruth said that the huge claims in back-to-back years from the fires have affected insurance companies’ ability to get reinsurance. (Reinsurance pays a share of the claims in the case of massive losses like with the fires, and is a critical component of the insurance [...]

I’VE MOVED!
I’VE MOVED! After 16 years with the same brokerage, I decided it was time to make a change, and I’m delighted to share that I’ve joined The Grubb Company! I chose The Grubb Company after lots of information gathering, and discussions with various brokerages. The Grubb Company was the clear choice, because of their longstanding commitment to our area (they have been in business for over 50 years), their excellent market share, their commitment to quality, the fantastic support staff, and most importantly, the caliber of the agents. The average agent at The Grubb Company does more business (measured by [...]

UC BERKELEY: MORE ACCOLADES!
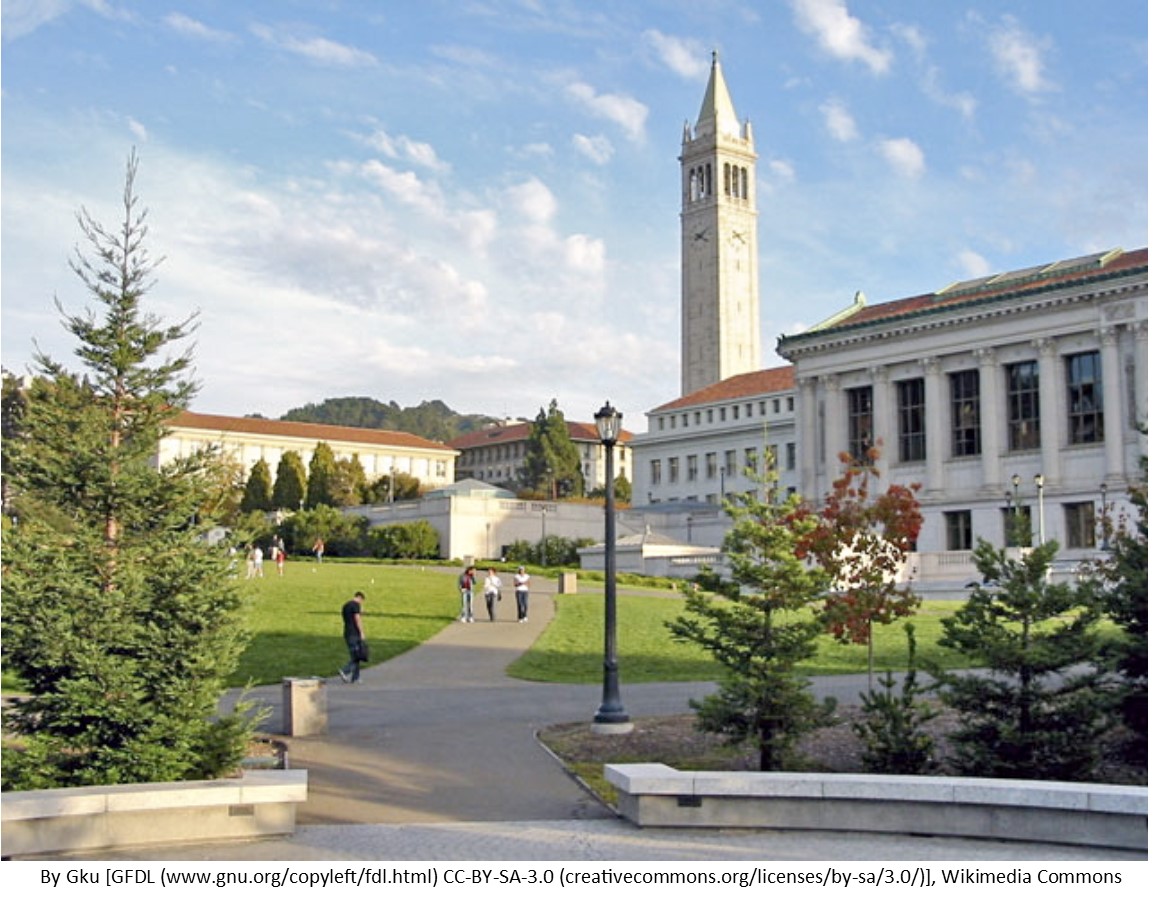
We already know that UC Berkeley is one of the top universities in the world, but I still love to see it getting the recognition it deserves. In the latest rankings of graduate programs by US News & World Report, there were many Cal programs that were among the top-rated. Cal was ranked #1 (or tied for #1) in Biological Sciences, Computer Science, English, Psychology and Sociology. I was especially excited to see the graduate program in Economics (which is where I got my PhD) also tied for the #1 position! Other Cal graduate programs that ranked in the top [...]
REAL ESTATE ANSWERS: How old is the housing stock in Berkeley?
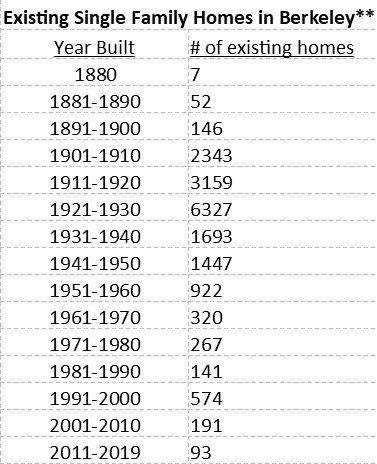
Many times over the years, when counseling new buyer clients, I have pointed out that the majority of the homes in Berkeley are older, built in the early part of the 1900s. I know this anecdotally, and from looking at so many homes over the years, but I had not seen any actual figures. I thought it would be interesting to look at the data, so I went to my handy public records database and looked at records for the single family homes in Berkeley. A couple things to keep in mind: (1) I only looked at structures that are [...]

REAL ESTATE ANSWERS: What’s changing as a result of the Berkeley measures on the 2018 ballot?
There were 2 local measures on the November 2018 ballot that were approved by voters that will impact local real estate going forward. The first was Measure P, which passed with 72% of voters saying yes. Measure P increases the Berkeley city transfer tax on property sales at prices over $1.5M, from 1.5% of the sale price, to 2.5%. Property sales at prices of $1.5M or less will still be taxed at the old rate of 1.5%. The measure says that the funds raised are intended to be used for “general municipal purposes such as navigation centers, mental health support, [...]

FREE STUFF (How to give it away)
I am a big fan of a good purge, and the new year is a great time to get rid of unwanted stuff. At the same time, I hate to throw anything away that someone else might be able to use, and non-profit donation centers only take certain items. For things that can’t be donated, I give them away using Freecycle, Next Door or Craigslist. I don't want to just leave things at the street until someone takes them -- it's unsightly, and the items can get dirty, or wet. I often don’t have time to coordinate schedules with people [...]
Go UC!
Money magazine just released their latest ranking of colleges and universities, and the University of California got 5 of the top 11 spots! Wow! To come up with the rankings, Money combines measures of “Quality of Education” (based largely on graduation rates), “Affordability” (net costs after financial aid, borrowing, time to graduation and student loan repayment rates) and “Outcomes” (measured mostly by alumni salary data). UC San Diego ranked 2nd overall, after only Princeton University. UC Irvine was 3rd, UCLA came in 4th, UC Berkeley was 7th, & UC Davis was ranked #11. One can definitely quibble about the order, [...]

REAL ESTATE ANSWERS: Why are there so many wild turkeys around these days?
This is not exactly a real estate question, but it is something I have been really wondering about myself! When I was growing up, I don’t remember ever encountering a wild turkey. Now it seems they’re everywhere, not just in the Bay Area, but in other parts of the country as well. A quick google search turns up articles about the abundance of wild turkeys in Massachusetts, Alabama, Chicago, Tennessee, Ohio, and lots of other places. Just a few days ago, I sat in my car at a stoplight and watched a gang of turkeys cross Marin Avenue at the [...]
THE OUTLOOK: North Berkeley & the Berkeley Hills, Q1 2024 wrap-up
THE OUTLOOK: North Berkeley & the Berkeley Hills, Q1 2024 wrap-up
How is the market doing so far this year? It’s been mixed. Higher interest rates are definitely having an effect. Some properties are selling quickly with multiple offers, and others are not. In general, properties that are well-presented (with good preparation, good staging, and good marketing), and that are strategically priced compared to similar properties, are selling well. There are a good number of first-time buyers in the market, who typically shop for smaller/less expensive homes. There are also wealthy or high-income buyers, who can afford a purchase even at higher interest rates.
Move-up buyers—people who own a home now, but want to move to get more space—are rare these days. When move-up buyers do the math on a larger home, they see that a new home would be more expensive because of the extra space and higher property taxes; this is always true. Now, they would also likely be giving up a loan in the 3% range, for one at closer to 7%, which makes the extra cost of the larger home significantly higher. As a result, a lot of these potential buyers are not moving. This means that demand for the larger homes is lower, and it also means that there is less inventory of smaller “starter homes” for sale.
***
Berkeley Hills, first quarter 2024 results:
The Berkeley hills had 53 active listings in the first quarter, and 32 properties sold. 6 of the sold properties had price changes before selling, and average time on the market was on the high side, at 38 days. 75% of the sales were above list price, and those that went over sold, on average, 32% above list price.
In the hills, the median sold price for the first quarter (Q1) was $1,750,617. This is down 10% from Q1 last year. Average sold price per square foot is basically unchanged from this time last year, though, at $900.
***
North Berkeley, first quarter 2024 results:
North Berkeley has been doing quite well. The median sold price was $1,447,750 in North Berkeley for the first quarter (Q1) of 2024, which is up 3% from Q1 last year. Average sold price per square foot, at $1,014, is also up, by 9%.
There were only 16 active listings in North Berkeley, which is the lowest Q1 figure in my database, which goes back to the year 2000. With few properties on the market, only 12 properties sold, in an average of 19 days, and none of the sold properties needed price changes. 92% of the sales were above list price, and those that went over sold, on average, 19% above list.
***
There are still multiple offers out there, especially for starter homes. At the same time, some good properties in the $2M-$3M range, especially those in the hills, are sitting longer on the market.
We’re all watching interest rates and the economic conditions that affect them closely. As long as the economy is performing pretty well, and inflation is still on the higher side, we’re unlikely to see significant rate cuts.
Berkeley is the (among the) best! / Going Green
Best Cities
Niche.com recently released its 2024 ranking for the “Best Cities to Live in America,” and Berkeley was #11! Berkeley was rated highly in the categories Public Schools, Good for Families, Nightlife, Diversity, Weather, Health & Fitness, Commute, and Outdoor Activities. Berkeley was bested in this ranking only by Irvine (ranked #6 overall) among California cities.
For full details, see niche.com/places-to-live/search/best-cities/.
Going Green
I am always looking to expand my knowledge of anything related to real estate, and I recently finished the coursework to be a designated “Green” Realtor®. The coursework covered a broad range of topics, from ways to upgrade existing homes and different types of energy audits and ratings, to features of green construction and smart growth for entire communities.
We talked about the “energy efficiency pyramid”, which suggests that, to improve the energy efficiency of our homes, we start with relatively cost-effective measures (like LED lighting and air sealing), before moving upwards towards projects of higher cost and complexity (efficient appliances, more insulation, then heat pumps). The most complicated and expensive projects —replacing windows and adding solar—would come last. The right improvements for a particular home will of course vary by location, preferences and circumstances. You can see the basic pyramid at 3blmedia.com/news/pyramid-conservation.
THE OUTLOOK: North Berkeley & the Berkeley Hills, Q4 and full-year 2023 results
THE OUTLOOK: North Berkeley & the Berkeley Hills, Q4 and full-year 2023 results
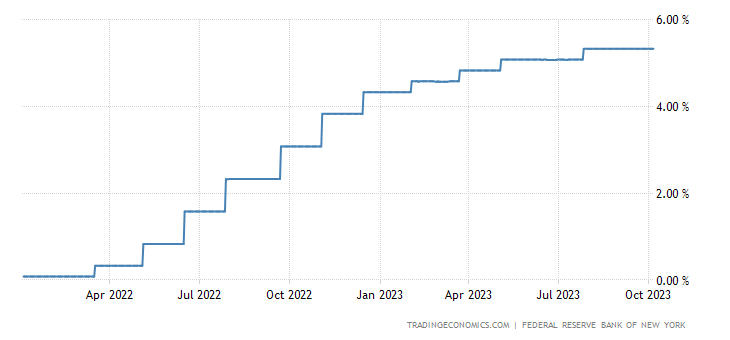
2023 was an interesting year in Berkeley real estate, where the driving factor was interest rates. Rates climbed to almost 8% during 2023, from around 3% at the start of 2022, with two main effects.
On the demand side, higher interest rates reduced demand by increasing costs for any buyer needing to get a loan. To give you a sense of the impact, a loan of $1M at an interest rate of 3% costs $4216/month; at 8%, the monthly payment on that same loan is $3122 more (or $7338/month).
Demand for homes fell, but, as discussed in previous newsletters, supply was down too, as potential sellers chose to stay put so they could keep their low-interest-rate loans. The number of homes listed for sale in 2023, in both Berkeley as a whole, and in the Berkeley hills specifically, was lower than in any year since before 2000 (which is how far back my personal database extends).
With low inventory offsetting the decrease in demand, the market was slow all year, but there wasn’t big downward pressure on prices. Looking at the data though, 2023 is not going to look as good in comparison to 2022, which had crazy high price results during the upward spike in the first part of that year.
***
North Berkeley, 2023 (full-year) and also Q4 results:
The median sold price in North Berkeley was $1,600,000 for 2023, and the average sold price per square foot was $989. Both figures are down from 2022 (by 3% and 5% respectively). Among the 75 properties that sold in North Berkeley in 2023, only 8 had price changes (all were price reductions rather than increases), and properties sold on average after 23 days on the market. 81% of the sales were above list price.
The market was especially quiet in the 4th quarter (Q4) of 2023. There were only 13 North Berkeley sales, and 9 of those went over list price. The median sold price was $1,420,000 (up 1% from Q4 in 2023), and average sold price per square foot in the 4th quarter was $937 (down 6% from Q4 last year).
***
Berkeley Hills, 2023 (full-year) and also Q4 results:
In the Berkeley hills, the median sold price for 2023 was $1,725,000, with an average sold price per square foot of $867. Both are down from 2022 (by 8% and 9% respectively), but both are a bit higher than in 2021. 113 properties sold in the hills over 2023, and there were only 17 price changes (14 price reductions, and 3 price increases). Properties in the hills sold on average after 23 days on the market, and 80% of the sales were above list price.
Looking at just the 4th quarter (Q4) of 2023, there were only 28 sales in the hills. 21 of those sold for more than their list price. The median sold price for the hills in Q4 was $1,545,000 (up 4% from the 4th quarter of 2022), and average sold price per square foot was $824 (which up 1%).
***
The good news going forward is that interest rates have come down, and might continue to head down over the coming year. Since late October when interest rates peaked at a bit below 8%, they’ve drifted downward into the mid-to-high 6% range. This is still double what rates were in early 2022, but hopefully we are heading in the right direction.
REAL ESTATE ANSWERS: What counts as a bedroom in real estate, and do more bedrooms add value?
What counts as a bedroom in real estate, and do more bedrooms add value?
A bedroom in general is just a room where people sleep. For a room to count as a bedroom for real estate purposes, there are several requirements:
(1) FLOOR SIZE. According to the standards used by appraisers, a habitable room must have a floor of at least 70 square feet in area and be at least 7 feet in any direction. So a 7’x10’ room is okay, but a 6’x12’ space, even though it’s 72 square feet, wouldn’t be counted as a room (or a bedroom) on an appraisal.
(2) CEILING HEIGHT. At least 50% of the ceiling must be at least 7 feet high.
(3) ENTRANCE. There should be a door to the bedroom from the interior of the house.
(4) EGRESS. There also needs to be an exit from the bedroom to the exterior. This can be a door to the outside, or it can be an exterior window. If it’s a window, it should be 24 to 44 inches from the floor, have an opening of at least 5.7 square feet, and it must be no less than 24 inches in vertical size and no less than 20 inches wide. (The point is to make it usable if someone needs to climb in or out in an emergency.)
Note that if you have an older home, built before these requirements were put in place and without the proper egress windows, the city is not going to knock on your door and require that you make the window openings larger. However, if you are doing a project that modifies the rough openings, you will be required to comply. And if you sell that home, it’s advisable to disclose that one or more “bedrooms” does not have an egress window.
Many people think that a bedroom has to have a closet. In California, that is not a requirement, although some local jurisdictions may have other requirements. Most buyers though do want to have a closet in or at least near each bedroom.
Do additional bedrooms always add value in a sale? Not necessarily. The first few bedrooms do add value to a typical Berkeley house, but only if the bedrooms are of reasonable size, and the remaining living space is of reasonable size for the number of bedrooms. Consider a 1000 square foot home with 5 bedrooms, for example. The bedrooms would have to be quite small, and there won’t be much living or storage space, which will make the property appealing to far fewer buyers. Even for a larger home, a 5-bedroom house doesn’t necessarily have more value (everything else being equal) than one with 4 bedrooms, as there are fewer buyers who need the 5th bedroom.
Bottom line: Bedroom count does matter for value, but only as part of the overall picture of a home and its function.
Color of the Year
Color of the Year
Design is an important aspect of my job, so I am always interested in color trends. These days, various companies, especially paint companies, annually announce one or more color(s) of the year. You can see a selection of these for 2024 here. (There are lots of interesting blues among them.)
The most impactful color of the year is chosen by the Pantone Color Institute, which forecasts global color trends. They have been designating a “color of the year” since 1999, and they were the first to do it. Pantone’s color of 2024 is Peach Fuzz, which they say “captures our desire to nurture ourselves and others. It’s a velvety gentle peach tone whose all-embracing spirit enriches mind, body and soul.” You can see it here.
Why do we care? These color selections definitely impact the retail and design world. You’ll see clothing, housewares, packaging, and lots more, in some form of Peach Fuzz this year. For real estate, you might see stagers adding accents to their inventories in similar colors, and there might be a shift towards compatible colors. It can be fun to update some home accents to follow a current trend, but always keep in mind that there will be a new “it” color next year, so I recommend sticking to something more classic for big, long-lasting items (exterior house color, major appliances, etc.).
THE OUTLOOK: North Berkeley & the Berkeley Hills, Q3 2023 results
THE OUTLOOK: North Berkeley & the Berkeley Hills, Q3 2023 results
The main feature of the Berkeley real estate market in the third quarter of 2023 was the combination of rising interest rates and low inventory of homes for sale. Interest rates on home loans have climbed to the high 7% range, reaching almost 8% as I write this. This is more than double what rates were at the beginning of 2022, so it’s not surprising that we’ve seen a reduction in demand for properties compared to last year.
At the same time though, there has been a decline in the number of homes on the market. For Berkeley as a whole, the inventory of homes for sale in the third quarter of 2023 was the lowest we’ve seen since before 2000.
This reduction in inventory offsets the reduction in demand, so we’re still seeing multiple interested buyers for the few properties that are listed, and prices have been pretty solid. That said, when we look at the stats for the past quarter and compare them to the same period last year, we are comparing to prices that had just started falling off the crazy peak at the beginning of 2022.
- The median sold price in the hills was $1,810,000 for the third quarter this year, which is actually higher than for the same period last year. Average sold price per square foot ($850), was 3% lower though. There were 59 active listings in the hills, which is more than for the third quarter of 2022, but it’s way down from the 93 properties for sale in Q3 2021. 35 properties sold this past quarter, in an average of 21 days on the market. 83% of the sales were over list price, on average by 24% for those that went over. Of the 35 sales, 5 needed a price change before finding a buyer.
- In North Berkeley, both the median sold price and the average sold price were down from Q3 last year. The median sold price in North Berkeley was $1,537,500, which is down 5%, and average sold price per square foot was 6% lower at $997. Like in the hills, there were slightly more active listings (47) in North Berkeley compared to the third quarter of 2022, but the number was also down a lot from Q3 2021, when 60 properties were on the market. 30 properties sold in North Berkeley in the third quarter this year, in an average of 26 days on the market. 83% of the sales were over list price, on average by 32% for those that went over. 4 of the sold properties had price reductions before selling.
Who are the buyers who are still out there these days? They’re not move-up buyers — most people are not willing to give up a 3% mortgage to get more space. The types of buyers who are in the market now are first-time buyers (who are mostly shopping in a lower price range than they would have been last year), buyers who have all cash or high enough income that the higher rates don’t matter, investors looking for projects, or people who have to move for some reason, like a job change.
REAL ESTATE ANSWERS: How do actions by “the Fed” affect interest rates on home loans?
How do actions by “the Fed” affect interest rates on home loans?
The Federal Reserve System (“the Fed”) uses monetary policy to keep the U.S. inflation rate low, and keep the economy operating at full employment. These are competing goals, so their work is a major balancing act. The Fed’s primary policy tool is changes in the federal funds rate, which is the rate at which commercial banks loan extra reserve funds overnight to each other (so it’s a very short-term interest rate). The Fed raises rates to combat inflation, and reduces them if they are trying to fight high unemployment. Since the start of 2022, they’ve been focused on eliminating the inflation that crept into the system during the main COVID years (2020-2021).
Interest rates on home loans are very long-term rates, since the typical home loan in the U.S. is a 30-year loan. They most closely track the rate on the 10-year Treasury note. Rates on home loans, like rates on 10-year Treasury notes, move up and down in response to economic conditions, changes in the return and relative riskiness of alternative assets, the availability of loanable funds, and current and expected future inflation rates. Rates on long term loans, like home loans, also depend on current and expected future short-term interest rates, so they are definitely affected by Fed policy.
In January of 2022, the Fed signaled that it was likely to start raising rates soon, setting off the real estate buying frenzy of early 2022, as buyers tried to get into the market before rates went up. The first rate increase by the Fed last year was in March of 2022, and by about this time last year, the target range for the federal funds rate was already up 3 percentage points, with more increases to come. By last fall, the Fed’s actions had resulted in a doubling of home loan rates, from the 3% range at the start of 2022, to about 6% in fall 2022. In the last year, the Fed has increased the target range for the federal funds rate 6 more times, for a total increase of 5.25% since the start of 2022. Today we’re looking at rates on homes loans that are approaching 8%.
When will interest rates go down again? Market rates are always bouncing around in response to new information, but we are unlikely to see a sustained reduction in interest rates until the Fed sees a need to stimulate the economy again, because inflation is low, and unemployment is increasing, or if they see a need to increase bank liquidity to keep the system functioning well.
Mobile Driver’s License
Mobile Driver’s License
Did you know that the California DMV has a mobile Driver’s License (mDL) pilot program running now, open to up to 1.5 million users? If you’re interested in giving it a try, start by downloading the free app called “CA DMV Wallet” from the Apple App Store, or from Google Play if you have an Android device, and then follow the straightforward instructions there. You create (or log into) your DMV account, enter some basic information, scan your driver’s license, and then “scan” your face (like you’re taking a selfie). Next you submit your request, and wait a few business days while it’s processed.
This idea of a digital ID card sounds cool to me, but it is not very useful at this point. You are still required to carry your physical driver’s license and present it if asked. For now, you can use the mDL at some (but not all) TSA Pre-Check lines, including SFO’s Terminal 3. (See https://www.tsa.gov/digital-id for a list of participating airports.) You can also activate “TruAge” within the DMV Wallet, and in theory use it to buy age-restricted items (alcohol, tobacco products, etc.) without sharing personal information such as your address. TruAge, though, is so far only accepted at a few Circle K convenience stores in the Sacramento area.
I suspect this sort of ID is the wave of the future, like the European Union’s Digital Identity Wallet, but for now it’s just a novelty here. I did sign up, just to check it out!
THE OUTLOOK: North Berkeley & the Berkeley Hills, Q2 2023 results
Looking at the market data for the second quarter of 2023, the theme seems to be “good news, bad news.” Let’s start with the bad. If you compare price results for the second quarter of this year to the second quarter of 2022, prices are, not surprisingly, down.
- The median sold price in the hills was $1,725,000 for the second quarter this year, which is down 12% from last year. The average sold price per square foot, $904, is 13% lower than it was for the same period last year.
- In North Berkeley, the median sold price in the second quarter this year was $1,825,000, which is down 5% from last year. Average sold price per square foot was $1043, which is down only slightly (by less than 1%) compared to the same period in 2022.
Remember though, there was a crazy run-up in real estate prices in the first part of 2022, and we’re comparing this year’s results to those (briefly) high values. Last year’s bubble popped in the middle of 2022 due to rising interest rates. We find ourselves now basically back to the very respectable values we saw in 2021, before the crazy run-up.
The good news is, there are still a lot of buyers in the market, especially compared to the limited amount of inventory.
- In the hills, there were only 59 active listings for the second quarter this year, compared to 83 last year. 86% of the sales were over list price, meaning that there were multiple offers for most of the properties. Properties that went over list price sold on average for 22% over list. Most properties sold quickly, averaging just 21 days on the market. There were 35 sales in the second quarter, and only one property needed a price change before selling.
- The results were similar in North Berkeley. There number of active listings was low, at only 38 (compared to 43 for the second quarter of 2022). 90% of the sales were over list price, and those sold on average for 26% over list. Most of the 21 properties that sold went as soon as the sellers took offers, but two were on the market for more than 3 months. Those two properties needed price reductions before selling, and they pulled up the average number of days on the market to 28.
The market is not as searingly hot as it was at the start of last year, but we’re not seeing anything like the wave of foreclosures and short sales that happened during the last big down cycle in the market. In all of Berkeley, there was only one bank-owned (foreclosure) property that sold in the first half of 2023, and there were only 2 short sales. Compare this to the first six months of 2012, when 33 foreclosure properties sold, and there were 34 short sales.
The bottom line is, there was an adjustment in the market, but the sky is not falling. Low inventory has kept the market very competitive for desirable homes. Buyers are pickier now, so the right preparation and correct pricing are more critical than ever to a successful sale.
REAL ESTATE ANSWERS: What’s going on in the home insurance market, and how does it affect current homeowners?
What’s going on in the home insurance market, and how does it affect current homeowners?
In late May, State Farm, which is the largest issuer of homeowners’ policies in California, announced that it would not sell any new home insurance policies in California. In addition, Farmer’s Insurance just announced that they will limit the number of new policies they sell here. Allstate also stopped issuing new policies in California last fall, so this is a significant trend.
Why are these big insurers pulling away from California at this time? Major wildfires in recent years have resulted in surges in claims, and climate change has made this much more likely to be the norm in coming years. Pandemic supply-chain issues and lingering inflation have meant that the cost of settling claims has gone up significantly. The cost of reinsurance, which is insurance that the companies get to protect themselves against excessive losses, has also gotten more expensive. The California Department of Insurance, though, limits companies’ ability to raise rates to cover higher costs and elevated risks, leading State Farm and Allstate to decide that it’s not worth selling new policies here.
Happily, this does not mean that existing State Farm and Allstate customers are losing their coverage. It does mean, though, that anyone looking for a new policy right now is going to find it more challenging, and more expensive. There are still lots of insurers selling policies in California, but there are fewer choices now. The remaining insurers are seeing increased demand for their products, which in theory would lead to higher prices. With pricing controlled by the California Department of Insurance, though, what we get are insurance companies that are much more selective in which properties they choose to insure.
This is not a good time to shop for a new or replacement homeowner’s insurance policy, so it’s also not a good time to do anything to give your existing insurer a reason to cancel. Be extra sure right now that the insurance bill is paid on time. If your insurance is paid by an outside party (such as a lender who collects money for taxes and insurance through an impound account, and makes those payments for you), it’s worth the effort to confirm that the payments are made on time, especially if your loan has been recently transferred to a new bank or servicer. If you are shopping for a new home, when you see one you like, you should plan to check insurability and get coverage quotes very early in the process.
Insurance companies are paying much more attention to the condition of the homes they insure, including their roofs as well as their plumbing and electrical systems. Many companies will not issue a new policy for a home that has older electrical (such as knob and tube wiring, or fuses instead of circuit breakers). If you are planning to sell your home, it’s worth seriously considering work that will make the home more insurable, such as replacing a wood shake roof or knob and tube wiring. Your current insurance policy will (sadly) not be transferrable to the new owners, and buyers need to be able to get insurance to get a loan.
N11 Refresher
N11 Refresher
Here’s a brief refresher on N11 quick-access phone numbers (where N is a number between 2 and 9) .
911 of course connects to a dispatcher for emergency services. Did you know, though, that if you call 911 on a cell phone, the call often ends up in a regional center, and then needs to be forwarded to more local help? If the call needs to be re-routed, this adds time to the process. This is not ideal in an emergency, so it’s a good idea to have your local, direct-access emergency number stored in your cell phone, so you can access a local dispatcher without that extra step. In Berkeley, that phone number is 510-981-5911. (Save this in your cell phone!)
The other N11 numbers are used for the following:
211: Referrals to services for housing, seniors, transportation, etc.
311: General city customer service
411: Local directory assistance
511: Traffic and transportation information
611: Phone company customer service
711: Relay service for the speech and hearing impaired
811: “Call before you dig,” providing information on the location of buried utilities.
Also, it’s not an “N11,” but there is one more important quick-dial number: 988 will take you to the National Suicide Prevention Lifeline.
THE OUTLOOK: North Berkeley & the Berkeley Hills, Q1 2023 results
A big question on many people’s minds lately is “how is the real estate market doing?” One important answer to that is that inventory has been really low so far this year.
- There were only 32 listings on the market in the Berkeley hills during the first quarter (Q1) of 2023, which is less than half the number from the same period last year. With so little inventory, there also weren’t many sales. The 15 sales in Q1 this year were also less than half as many as in the first quarter of 2022.
- In North Berkeley, there were only 19 listings on the market in North Berkeley during the first quarter (Q1) of 2023, and only 11 sales. With so few sales, it means that the summary statistics are going to be influenced a lot by the specifics of the properties that sold.
Why is inventory so low? In addition to the factors I mentioned in the last newsletter (concerns about market conditions and sellers not wanting to give up their existing low interest rate loans), the weather has also affected plans. One of the most common things sellers do to prepare their homes for the market is painting, and many exterior painting projects have been delayed because of all the rain we’ve had. In general, low inventory (and lack of competition) is good news for those homes that did come on the market.
***
Berkeley Hills, Q1 2023 results:
For the first quarter of 2023, the median sold price in the hills was $1,935,000, which is up 30% from the previous quarter, but down 4% from this same period in 2022. These numbers reflect the 2022 rollercoaster market—the huge upward spike in prices at the beginning of the year, completely reversed by the end of the year as interest rates climbed.
Average sold price per square foot for Q1 2023 was $901, which is again higher (by 11%) than the end of last year, but down (by 6%) from the first quarter of 2022.
Four properties had price reductions before they sold, and properties spent on average 31 days on the market. (Not surprisingly, it was the four properties that reduced their price that pushed the average days on the market up.)
Two-thirds of the sales were for more than list price, on average 24% above list for those that went over.
***
North Berkeley, Q1 2023 results:
The median sold price in North Berkeley was $1,400,000 in the first quarter. This is down very slightly (0.2%) from the previous quarter, and down 13% from this same period in 2022 (when prices were spiking).
Average sold price per square foot for Q1 2023 was $928, which is down 7% from the end of last year, and down 16% from the craziness of the first quarter of 2022.
There were no price reductions, and properties sold very quickly, on average after just 13 days on the market, which is even faster than during early 2022. I think these two facts better represent how the North Berkeley market is faring overall than the price statistics. Condos made up a bigger share of the total, which pulls down the median price, and one large very funky property on MLK sold for just $517 per square foot, which pulled down that average. At the same time, there were 4 single family homes that sold over $1000 per square foot, up to a high of $1436 per square foot for a 2-bedroom bungalow on McGee.
In North Berkeley, 73% of the sales in the first quarter were for more than list price, on average 25% above list for those that went over.
***
Buyers are still out there, but with the perception that the market has cooled, they are definitely more picky. Properties that are not well-prepared and/or not appropriately priced are sitting on the market, while those that are well done are selling quickly with multiple offers.
More Recycling
More Recycling
I started using a new paid recycling service called Ridwell in January, and I have to say, I have been loving it. Ridwell charges $14 to $18 per month (depending on the number of months you commit to), and comes to your house every two weeks to pick up items that our regular City recycling pickups don’t collect. They pick up plastic film (including most bubble wrap, grocery and newspaper bags, and the outer packaging on many items), batteries, light bulbs, and threads (clothing and other fabrics) every time, plus they have one additional special category on each pickup day. Check out ridwell.com for details.
I was amazed, and appalled, to see how much plastic film passed through my house, once I started collecting it to be recycled. I feel better knowing that it is at least being recycled (Ridwell ships it to a factory that makes Trex decking). The whole experience has made me pay much more attention to packaging, since yes, reducing the amount I use is even better than recycling it.
With Ridwell, you’re paying for the convenience of having them pick up the items. You can, though, recycle or donate the same things without paying Ridwell to pick them up. Many grocery stores will take plastic film (see bagandfilmrecycling.org for a list), Berkeley Recycling (at 2nd and Gilman) accepts unbroken fluorescent light bulbs and batteries, and there are also various places to donate clothing and other items.
REAL ESTATE ANSWERS: What is (or was!) the California “Dream For All” program?
What is (or was!) the California “Dream For All” program?
There have been many programs over the years aimed at helping first-time buyers get into the expensive California housing market, but they have mostly been so restrictive that few people were able to use them. The less-restrictive “Dream For All” program from the California Housing Finance Agency is targeted to low and moderate income first-time buyers.
It provides funds for down payment and closing costs through a shared appreciation loan of up to 20% of the purchase price.
Here’s an example of how it can work. A qualifying buyer uses an approved lender, and gets a “regular” loan for 80% of the purchase price, combined with a 20% Dream For All shared appreciation loan. The buyer, in this example, only needs to have funds to cover closing costs (which might be, very roughly, 5% of the purchase price).
The buyer makes regular payments (principal plus interest) on the 80% loan, but there are no ongoing payments on the shared appreciation loan. Instead of paying interest on the Dream For All assistance funds, when the property is sold, the assistance funds are repaid, along with a share of the appreciation on the property. If the Dream For All assistance was 20% of the purchase price, the program gets 20% of the appreciation.
There are other programs out there for buyers without a lot of down payment money, where the borrower only needs to put around 3% of the purchase price down. In the Dream For All scenario, though, the monthly payment (on 80%, rather than 97% of the purchase price) is lower, and there is no mortgage insurance as long as the “regular” loan component is 80% or less of the value.
Here are some of the requirements of the Dream For All program:
- The property must be a 1-unit/single family home or a condo, purchased as the primary residence of the new owner.
- Non-occupant co-signers are not allowed.
- The maximum income to qualify in Alameda County is $282,000.
- You must be a first-time buyer, BUT they define a first-time buyer as someone who has not owned a home in California in the last three years.
- The maximum “regular” loan amount is $1,089,300, which means that, with 20% Dream For All assistance, the maximum purchase price would be $1,361,625.
- The buyer has to take a Homebuyer Education and Counseling course.
For more details, see www.calhfa.ca.gov/dream/.
Here’s the bad news — the program was so popular, that its funding, which was expected to last until early fall, ran out in not even 10 days! It’s unclear whether the state will provide additional funding, but if you know someone who might qualify and be interested, they should watch and be ready to act quickly if more funds are added.
THE OUTLOOK: North Berkeley & the Berkeley Hills, Q4 and Annual 2022 results
Last year was the craziest roller coaster I’ve ever seen in our local market. We started 2022 with an intense surge in buyer activity, but that surge was reversed by the summer and through the end of the year, as buyers adjusted to higher interest rates, concerns about the economy, and declines in the stock market.
***
NORTH BERKELEY:
Looking at 2022 as a whole, the median sold price in North Berkeley was $1,650,000, which is unchanged from the previous year. Average sold price per square foot, at $1046, was up 7% compared to 2021. Properties in North Berkeley sold on average after 19 days on the market, which is pretty typical. Out of a total of 87 sales during the year, only 9 properties had price adjustments before selling (3 were price increases, and 6 were price reductions). 87% of the sales were at prices above list price, and those sold on average for 32% more than list.
The figures for the whole year are of course combining the results from the crazy spring and the much slower latter portion of the year. The fourth quarter data (for October through December 2022) is more indicative of where the market is now. In the fourth quarter, the median sold price for North Berkeley was $1,402,500, which is down 15% from the fourth quarter of the previous year. Average sold price per square foot was $1000, which is also down, but only slightly, by 0.5% compared to the same period in 2021. There was a big change in the number of properties listed for sale during the fourth quarter this year. There were only 20 properties on the market in North Berkeley, compared to 33 during the same period in 2021.
***
BERKELEY HILLS:
In the hills, the median sold price for 2022 as a whole was $1,870,000, which is up 10% from the previous year. Average sold price per square foot was $953, which is also higher, in this case up 11% compared to 2021. Properties in the hills sold on average after 19.6 days on the market, which is the quickest we’ve seen since 2016. There were not a lot of price changes in the hills either. Out of 181 sales, there were only 8 price increases and 7 price reductions. 81% of the sales were at prices above list price, and those sold on average for 33% more than list.
Looking at just the fourth quarter, the median sold price for the hills was $1,661,541, which is down 10% from the fourth quarter of the previous year. Average sold price per square foot was $815, which is also down, but only by 1% compared to the same period in 2021. There were 40 properties on the market in the hills—just under half the number of listings during the same period in 2021.
***
We start 2023 with interest rates about double what they were at the start of 2022. Rates are in the mid-6% range now, and they were in the low 3% range in January 2022. The higher rates have had a big impact on affordability, which reduces demand for properties. Supply though is also lower, because sellers are concerned about market conditions, and they also don’t want to give up existing low-interest loans and borrow at higher rates on a new property.
For people who would be buying their new home without a loan, this is actually a fantastic time to make a move. For those who would be trading a low-interest loan for one with a higher rate, keep in mind that more favorable pricing could more than offset higher interest costs.
REAL ESTATE ANSWERS: What design trends are you seeing now for kitchens?
What design trends are you seeing now for kitchens?
Here are ten trends for kitchen design I have been seeing in publications and in our local market:
- Stark all-white kitchens are becoming less popular. People are looking for more warmth, which can come from materials or color.
- Unpainted wood cabinetry is increasingly popular; the grain and color of the wood add warmth and a natural element to the overall design.
- If cabinets are painted, we’re seeing less gray and less white, and more shades of blue, green, saffron, and ivory.
- The use of open shelving for storage is trending downward, as people factor in the impracticality and required upkeep. Some open shelving for display space rather than everyday use is still popular.
- Fancy statement-making range hoods are less popular, with more people opting for something simpler to fit in with a clean aesthetic.
- Countertop materials can go in two directions: we’ve been seeing more natural stone with color and patterns of flowing wavy movement, but a clean, simple quartz is also popular. Which of these makes sense in a design depends on the surrounding elements. Is the stone the statement piece in an environment that is otherwise clean and simple, or are there surrounding elements (wood grain on cabinets, or pattern on the backsplash or flooring) with which you don’t want to compete?
- Solid slab backsplashes, generally in the same material as the counters, are becoming more popular.
- Microwaves over the range are feeling dated.
- The trend from last year toward more natural materials like rattan or rope is continuing. In the kitchen, we see it on pendant lights and seating.
- For hardware, last year we saw a lot of matte black for faucets, cabinet handles and lights. Brass or gold finishes have also been popular for these items. These finishes have not gone away, but designers say that polished chrome is coming back, which is always a good classic choice.
Kitchens are an important component of property value, so it’s a good idea to consider how long you are expecting to be in the house if you are planning a remodel.
If you are going to sell the property fairly soon, you’ll get the best return if you factor in current trends. As the time until you’ll want to sell gets longer, the more it makes sense to choose more classic and neutral finishes for the big-ticket and harder-to-change components. Beyond a certain point though (20 or 30 years?) anything you choose today is likely to feel dated by the time you sell, so you can feel free to go for whatever you like the most!
Changes Afoot!
Changes Afoot!
My 20-year anniversary in real estate has inspired me to look over my work systems and find ways to improve going forward. One area that I have re-vamped is the way I collect and analyze local market data. My goal has been to reformat my ongoing database to make it easier to create charts and graphs. I’m also going to start saving data for Berkeley as a whole, in addition to data for North Berkeley and the Berkeley hills.
Another change: In the past, I have looked at real estate “seasons” that correspond with the level of activity we see in the local market. The winter season was defined as December through February, corresponding to the slowest time of the year in our market, and spring (March through May) corresponds with the busiest. Going forward, I am going to instead focus on quarters as traditionally defined. So instead of winter (December, January, February), I’ll track and discuss Quarter 1 (January, February, March), and so on. Since real estate transactions take weeks to close, roughly half the properties that go into escrow in one month close (and show up in the sale data) the following month. This means that switching to quarters won’t make a big difference conceptually, and there are benefits to using quarters in terms of chartmaking and recordkeeping.
THE OUTLOOK: North Berkeley & the Berkeley Hills, Summer 2022 results
The real estate market over the summer was noticeably more subdued than in the first half of the year. Buyers were in an absolute frenzy in the spring, anxious to get into the market before interest rates increased, and as a result, prices went up sharply.
Over the summer, the spring spike in prices vanished, as buyers became much more cautious. A number of factors together explain why the summer market slowed. The stock market went down (affecting buyers’ down payment funds), and interest rates went up (affecting affordability). Some buyers could no longer afford the type of home they were previously looking at, and there was a pause as they adjusted their plans and expectations. There were also more buyers traveling this summer compared to last. This is the typical seasonal pattern, where the market slows in the summer because people are away. We didn’t see it last year, when fewer people traveled because of COVID, but this year, it was again a factor.
***
NORTH BERKELEY:
Over the summer, there were 34 active listings in North Berkeley, and 24 properties sold. Properties took a bit longer to sell on average, 19 days, compared to an average of 13 days over the spring.
The median sold price for the summer was $1,675,559 in North Berkeley. This is down 5% from the spring (this is the big spring spike in prices going away), but it is still 6% higher than last summer. Sold price per square foot was $1091, which is actually up 5% from the spring, and up 16% from last summer.
***
BERKELEY HILLS:
The Berkeley hills had 49 active listings over the summer, and 48 properties sold. The average days on the market was higher here too compared to the over the spring: 19 days over the summer, compared to 16 days over the spring.
In the hills, the median sold price for the summer was $1,917,500. This is down 4% from the spring (this is the big spring spike in prices going away), but it is still 20% higher than last summer. Sold price per square foot was $916, which is down 15% from the spring extreme, but up 3% from last summer.
***
Most of the summer sales —88% of them in both the hills and North Berkeley—were over list price, but there weren’t as many offers per property. List prices have finally adjusted upwards, and that, along with the more cautious buyer pool, meant that sale prices were not as far above list as in the spring. We seem to be back to our normal 20% – 30% above list price on average, instead of the 40% -100% overbidding that was common in the spring.
What’s going to happen from here? The market has backed off of the spring’s extremes to a more reasonable level. Barring some major economic upheaval, I think we’ll see a pretty stable market going forward, one that is more balanced between buyers and sellers.
It’s been 20 years!
It does not feel like it has been this long, but this October marks twenty years that I have been a full-time realtor in Berkeley. I started in real estate with my salesperson’s license in October 2002, and then completed the additional certifications to get my broker’s license in 2006.
It was a hard decision to change careers from academia to real estate (I was previously an economics professor at the University of San Francisco), but real estate is my passion, and I haven’t regretted it. I get to apply my economics background in things like analyzing market conditions, thinking strategically in negotiations, and doing cost-benefit analyses to help clients make smart financial decisions. I also get to be creative, in designing marketing materials, putting together the perfect photo package of a new listing, or envisioning the ideal look for a property going on the market. The combination of analysis and creativity is the perfect mix for me.
Over the last 20 years, a lot has changed in real estate. Technology has advanced and made it possible to do important tasks electronically, from preparing paperwork, to getting the word out about a new listing, to signing contracts. Social media advertising and individual property websites have become important components of a good marketing plan.
What hasn’t changed? Berkeley continues to be a great place to live, and a very desirable and resilient real estate market!
REAL ESTATE ANSWERS: How has the negotiating environment changed as the market has shifted?
How has the negotiating environment changed as the market has shifted?
When the real estate market is at its strongest, there is not a vast amount of negotiation between buyers and sellers. Buyers make strong offers in competition, often waiving the inspection contingency, and many sellers choose to accept the best offer, rather than negotiate and risk de-stabilizing the transaction. When the market is more balanced, there are fewer offers on properties, and buyers may not feel that they have to make their best offer at the start. An accepted offer might also have an inspection contingency, so there may be further negotiations during the inspection period.
Most real estate negotiations are over dollar amounts (although timing and other terms can also be negotiated), but the same dollars can be factored into a contract in different ways: as a change in price, as a change in who is paying various closing costs, as a credit towards closing costs for the buyer, or as a buy-down of the buyer’s interest rate by the seller. Each of these possibilities affects the buyer’s and seller’s bottom lines differently, so a strong, creative negotiation strategy weighs the effects of each to find the right one or the right mix.
From a financial perspective, the seller’s goals are relatively simple. Sellers want to maximize their net proceeds, so they want the price as high as possible, and their costs as low as possible. The buyer side is much more complicated. Buyers want to minimize their cost for the purchase, so to keep the sale price and their closing costs as low as possible. Buyers also want to minimize their ongoing costs of ownership: their loan payments (if any) and their annual property taxes. In addition, buyers will consider the available cash they will have after the purchase to make needed repairs or improvements.
When I am negotiating for a seller client, my first step is aways to gather as much information as possible about the buyers and their circumstances. Are they getting a loan? Will they have plenty of cash on hand after the purchase for needed repairs? Is the monthly cost of ownership their primary constraint, or do they ultimately care the most about the overall purchase price? Will their lender allow credits toward closing costs? How much will a point paid on their loan reduce their monthly payment? Using that information, I can then consider all the various ways to structure potential contract changes, to find an option that will be the most attractive to the seller, while making the deal work for the buyer.
It is all quite complex, but it’s an important part of the process. One of the benefits of longevity in this business is having experience navigating markets of all different strengths. I guess that makes up for the extra wrinkles the years have also brought me!
THE OUTLOOK: North Berkeley & the Berkeley Hills, Spring 2022 results
There has been a lot going on in the real estate market since my last newsletter, when I wrote that competition between buyers was looking especially intense. The prospect of increasing interest rates always motivates buyers to find something before rates go up, so they bid extra hard for available properties. As a result, we saw more incredible sale prices during the spring, and the market reached a new peak.
****
NORTH BERKELEY
There were 39 properties on the market in North Berkeley over the spring season (March through the end of May), and 27 properties sold. Of these, all but two sold for more than list price, on average by 35% above list. Nine of the 27 sales (so 1/3 of them) were at prices more than 50% above list. Only one property (a condo on Oxford Street) reduced its price before it sold.
The median sold price for Spring 2022 in North Berkeley was $1,761,348, which is up 14% from the winter, and 11% from Spring 2021. More of the sold properties during the spring were larger homes than we typically see, so that pushed up the median price, and that also pushed down the average for sold price per square foot. At $1040, sold price per square foot was a bit lower than over the winter, but it was still 8% higher than last spring.
****
BERKELEY HILLS
There were 95 properties on the market in the Berkeley hills in the spring, and 70 properties sold. Of these, all but four sold for more than list price, on average by 40% above list. Just like in the North Berkeley area, about a third of the sales were more than 50% above list price (23 of the 70 sales)! There were no price reductions in the hills, but four properties increased their list price before they sold. This typically means that the property was originally listed below market value, but didn’t get the offers they were hoping for, so they raised the list price to a price the seller would actually accept.
The median sold price in the hills was $2,005,000 over the spring — this is the first time it’s been over $2M. This median price is up 4% from the winter, and 20% from Spring 2021. Sold price per square foot was also quite high, at $1077 per square foot. This figure is up 20% from both last quarter and from spring 2021.
****
Interest rates on home loans are up dramatically, in response to higher inflation and current and expected future rate increases by the Fed. Most recently, on June 16th, the Fed announced a big 0.75% increase in the Federal funds rate, and home loan rates shot up even more. Rates on home loans are now at the highest level in the last 10 years (more on this in “Real Estate Answers”).
Because of the higher rates, we’ve seen a definite shift in the market as we head into summer. Buyers are still out there, but they are more cautious and more picky. We’re still seeing multiple offers, but not as many offers for each property. In this sort of environment, strategic pricing and well-conceived preparation are absolutely crucial, but when it’s done right, sale prices are as high as ever. My recent listing on Buena Vista Way (2580BuenaVista.com) got 4 offers, fewer than we would have seen earlier in the year, but it still sold for a price the seller was thrilled with!
REAL ESTATE ANSWERS: How much difference do higher interest rates make for home sales in our area?
How much difference do higher interest rates make for home sales in our area?
Over the spring, the Federal Reserve announced a plan for multiple interest rate hikes this year to try to get inflation under control, and we’ve seen three rate increases already this year. As I write this, interest rates on home loans are approaching 6%, up from about 3% at the start of the year. Interest rates are at their highest level in 10 years, and there may be additional increases to come.
Increasing rates make a lot of difference in the purchasing power of individual buyers. For sellers and property values in our market, where we have excess demand, the impact is not as extreme, but it does definitely affect the market.
Consider individual buyers who are qualified for at most a $1 million dollar home loan (to choose a round number) when interest rates are 3%. This means that they are qualified, given their income and other debts, for a maximum monthly loan payment of $4216. When rates go up to 6%, assuming the buyers can afford that same payment, they now only qualify for a loan of $703K (so they can spend $297K less on a home, compared to when rates were at 3%). As a very rough rule of thumb, the maximum loan amount people can qualify for goes down about 10% each time the interest rate goes up by one percentage point.
Another way to think about this – a particular buyer might need something like $230K of household income to qualify for a $1M home loan when the interest rate is 3%. (The actual income requirement will depend on things like credit rating, other debt, etc.) When the interest rate rises to 6%, that same buyer would now need over $300K in income to qualify.
How do buyers respond to increasing interest rates? With less purchasing power, buyers need to adjust their expectations. They could look for a smaller home, a less expensive location, or a home that needs more repairs or improvements. Other buyers, who were not already planning to spend their max, might decide to go closer to their limit, and still buy the same thing.
In thinking about how higher interest rates affect our market as a whole, the crucial question is, will there be fewer buyers at particular price points after all this happens? In our market, we have had an excess of buyers at various price points, and a good number of cash buyers as well. Some buyers will need to move down a price category, but there should be other buyers (moving down from higher price points) to take their place. And yes, some buyers will be unwilling to compromise on their purchase and may choose not to buy now at all.
Overall, I would expect there to be somewhat fewer buyers in each price point. There was so much excess demand before, though, that there should still be enough buyers out there to keep the market stable.
Bulky Waste and an E-Waste Resource
Did you know that, as a Berkeley homeowner, you can schedule one free bulky waste pick-up per calendar year? Just call (510) 981-7270 to schedule for an upcoming Wednesday. They’ll pick up a maximum of 3 cubic yards, which they say is the equivalent of about 20 large trash bags. Everything they pick up goes to the landfill, so be sure to separate out recyclables, green waste, and consider Urban Ore for items that can be re-used.
Some things are not eligible for the bulky waste pick up. Included on the “not OK” list are things like hazardous waste items, mattresses and large appliances, tires, auto parts, and items (other than sofas) that are more than 5’ long or 50 pounds in weight. They also do not take electronic waste, but there is a non-profit that does.
The Ewaste Collective, located at 620 Page Street, is a non-profit committed to household electronics and computer recycling (ewastecollective.org). They accept monitors, TVs, computers, keyboards, cell phones, tablets, wires & cables, microwaves and toasters, printers, scanners, fax machines, game consoles and games, and more. This is a great resource, not only because you can be confident that your electronic waste is being handled properly. They also refurbish computers and give them away to those in need. Your drop-off may be tax deductible, and they will wipe the memory of your computer for a $10 fee.
THE OUTLOOK: North Berkeley & the Berkeley Hills, Annual 2021 & Winter 2021-22 results
It’s time as usual to look at the previous year’s results for our local real estate market, and also talk about the results for the winter season just ended.
2021 started off with a bang. A big upswing in buyer interest led to major competition between buyers, which led to big price increases. The craziness moderated somewhat later in the year as interest rates started increasing and more homes came on the market for sale, but values stayed at the new higher levels.
In 2021, there were more properties on the market in both North Berkeley (127 active listings) and in the Berkeley hills (272 active listings) than we’ve seen for years, but it was still not enough inventory for all the interested buyers.
****
NORTH BERKELEY
115 North Berkeley properties sold over the year, and 79% of the sales were for more than list price. List prices have not increased as much as values have, so all last year (and continuing now) we saw even more serious overbidding than is typical for this area. For the properties that sold over list price, the average was 30% over, but more than 50% above list was not uncommon. Some Berkeley properties sold as high as double the list price.
The median sold price for 2021 in North Berkeley was $1,650,000, which was an increase of 22% over 2020. Sold price per square foot, at $984 per square foot, was 11% higher than the previous year.
The winter season just ended (December 2021 through the end of February 2022) was very similar to the start of last year, with intense buyer interest. Inventory was back to its usual low level (there were only 18 active listings, and 17 sales for the 3 months), but buyers again seemed extra motivated and there were some epic bidding wars.
The median sold price for the winter season was $1,550,000. This figure is lower than for 2021 because more small properties sold, but it is 30% higher than last winter. The average sold price per square foot from December to February was a whopping $1091, which is up 10% from the fall, and up 29% compared to last winter.
****
BERKELEY HILLS
234 properties sold in the hills during 2021. 52% of them sold above list price, by 25% over on average, but again, far far greater overbids (by $1 million or more) were also happening.
The median sold price in 2021 for the Berkeley hills was $1,700,000, which was an increase of 13% over 2020. Average sold price per square foot, at $861 per square foot, was 12% higher than the previous year.
For this past winter season (December 2021 through the end of February 2022), inventory was low (there were 44 active listings, and 38 sales for the 3 months), but buyer interest was intense. The median sold price for the winter season was $1,925,000, which is 24% higher than last winter. The average sold price per square foot was $899, which is up 11% from the fall, and up 12% compared to last winter.
****
So far spring, 2022 is looking like more of the same. Inventory is picking up somewhat, but the prospect of higher interest rates to come (because of higher inflation) is keeping buyers motivated and the competition for available properties very high.
Variations in Sold Price per Square Foot
If you are a regular reader of this newsletter, you have many times encountered the notion that, everything else being equal, the amount a property sells for per square foot of living space tends to be lower for large homes, and higher for small homes. To illustrate this point, I grouped the detached homes sold in North Berkeley and the Berkeley hills* over the course of 2021 by size category, and found the average sold price per square foot for each category. The results are above.
As you can see, the pattern holds as a general rule: the larger the home, the lower the sold price per square foot, everything else being equal. For specific properties though, everything else isn’t equal, and characteristics such as a large lot, architectural pedigree, views, etc., still push up the value in general, and in price per square foot.
REAL ESTATE ANSWERS: Why are most sellers in our area no longer accepting “love letters” from buyers?
Why are most sellers in our area no longer accepting “love letters” from buyers?
In our market, where buying a home is a super-competitive process, it used to be the case that buyers would include a “love letter” with their offer in hopes that it would influence the seller in their favor. The letter would tell the seller about the buyers, their qualifications, and why this property would be the perfect home for them. It also often included a photo of the buyers.
The idea was that, because many (even most) sellers have some emotional attachment to the property they’re selling, providing more information about the buyers and how much they appreciate the property could highlight commonalities and make it easy for the sellers to picture a particular set of buyers as the new owners. Maybe the seller would think “Oh, these buyers are a cute young couple who want to raise their family here like we did!” Or, “Look, we both work for X Company!” Or “These people love to garden, so will maintain the yard I put so much effort into!” Buyers hoped that these commonalities might lead the seller to choose their offer over others (maybe even if their price wasn’t quite as high).
The problem with these letters is that they can reveal information about the buyers that the seller cannot legally consider in choosing between offers.
Sellers are prohibited by law from choosing a buyer based on any of these criteria: race, color, ancestry, national origin, religion, sex, sexual orientation, gender, gender identity, gender expression, marital status, familial status, source of income, disability, medical condition, citizenship, primary language, immigration status, military/veteran status, age, criminal history, and any arbitrary determination.
Notice that my “cute family” example above is on the list of prohibited criteria (familial status), and “We both work for the same company” is related to source of income.
Even the best-intentioned seller, who would never knowingly violate Fair Housing laws, could be subconsciously influenced, and even if this is not the case, it is still safer as a seller to not have information related to the prohibited criteria at all. In our super-competitive market, there are routinely multiple unsuccessful buyers, and there is always the risk that an unhappy buyer whose offer was not accepted could claim that a decision was influenced by something that is in a protected category.
The safest choice is to “just say no” to buyer letters. If you as the seller do not have information the about buyers’ characteristics, it’s hard for someone to say that you made a decision for the wrong reasons. I think skipping the buyer letters is not just the safest choice, but it’s also the right choice, because it levels the playing field for everyone.
THE OUTLOOK: North Berkeley & Berkeley Hills, Fall 2021 results
I mentioned in the last newsletter that the market seemed to be cooling off a bit from the spring frenzy, and that was true through most of the fall season. That has changed recently (the market has been crazy hot again in December!), but we won’t have data on that until next year, when the currently pending sales have closed escrow. Over the fall, inventory was relatively high, and it was the competition between properties that made the market a little cooler than earlier in the year.
Prices are still sky-high though. Sales over $2 million are now not uncommon in Berkeley (there were 9 over the fall season in North Berkeley and 15 in the hills), and for the first time ever, we’re regularly seeing sales over $3M (there were two in North Berkeley and 6 in the hills in the fall).
****
NORTH BERKELEY
There were 49 active listings in North Berkeley over the fall, and 37 properties sold. These figures are higher than both this past summer, and last fall. The average number of days on the market for the sold properties was 13, which means that almost everything sold as soon as the sellers started accepting offers.
The median sold price from September through November was $1,715,000 in North Berkeley. This is up 8% from the summer, and up 23.5% from last fall. The average size of the sold properties was a bit larger than is typical, which corresponds with a more modest increase in sold price per square foot. On average, properties in North Berkeley sold for $988 per square foot, which is 5% higher than over the summer, and up 7% from last fall. Most of the sales — 89% — were for more than list price, on average 31% above list price for those that went over. Eleven of the sales were for 40% or more above list price, up to a high of 67% over list.
****
BERKELEY HILLS
There were 90 active properties in the hills over the fall, and 73 properties sold. The average number of days on the market for the sold properties was 14.
The median sold price from September through November was $1,730,000. This is up 8% from the summer, and up 13% from last fall. Average sold price per square foot over the fall was $812, which is lower than over the summer, but up 3% from last year.
Most of the sales —79% — were for more than list price, on average 23% over, but results were mixed. 15 of the sold properties went for list price or under. At the opposite extreme, 11 of the sold properties went over list price by more than 40% (up to a high of 81% over). Eleven of the sold properties needed price changes — 3 reduced their list price, and 8 increased it — before finding a buyer.
****
For the winter season (starting December 1st), the weather has cooled off, but the market has heated way up, in a way I’ve never seen before in my 19 years in real estate. The combination of a lot of motivated buyers and a lack of inventory (because winter is usually — at least in the past — not the best time to sell) has led to some epic bidding wars. We’ll see those results in the next issue. Until then, I send you my best wishes for the holiday season, and for all of the new year!
REAL ESTATE ANSWERS: Should I be careful not to over-disclose when I’m selling my home?
Should I be careful not to over-disclose when I’m selling my home?
Completing seller disclosure forms in California can be a daunting task. A seller is legally obligated to disclose all known material information about the property to the buyer, and can be sued for hiding defects or problems. A material fact is any piece of information that would affect the buyer’s decision to purchase the property. To meet this obligation, sellers complete a series of detailed questionnaires about the current condition of the property, ongoing maintenance, past repairs and upgrades, and a whole array of other topics. Some of the questionnaire forms are specifically required by the state or federal government, and the others are like a guided walk down memory lane, making sure sellers think about and pass along information within many different relevant categories.
In completing these forms, it’s not uncommon for a seller to worry that they’re over-disclosing – telling the buyer too much – and that they’re going to hurt their sale. My general rule of thumb for disclosures is this: If you wonder if you should include something in the disclosures, the answer is always yes. Why? Because if it’s an item that the buyer cares about, then it’s a material fact, and you are required to disclose it. If the buyer doesn’t care, then it’s not hurting anything to have it there.
Carefully completed disclosures are important not just because of the legal requirement, but also because they set the tone for the transaction, and establish a baseline level of trust between the parties. If the seller has lived in the property for many years, but discloses next to nothing, buyers don’t feel confident that they’re getting an accurate picture of the property, which makes them worry about unknown problems. They may also think the seller is not playing fair, which affects their impression of the whole property, and their behavior in the transaction, including their willingness to be flexible when procedural things come up during escrow (and procedural and other issues often do come up!).
Disclosure forms include questions that ask you to describe all work and improvements you’ve done on the house, plus repairs needed now and those done in the past, plus ongoing maintenance. Putting together all of this information can be challenging, especially if you’ve owned the home for many years. Including a lot of detail, though, especially about more recent improvements and repairs, gives the buyer the sense that the property has been well-maintained and improved over time.
Even if you’re not thinking of selling anytime soon, it will make your life much easier when the time comes if you start a list (or a spreadsheet, or a file) now, and update it when you have a new improvement or repair. For each item, record three things: what was done, who did it, and when. For recurring maintenance items, there’s no need to keep track of every time the tree trimmer or gutter cleaner came; just keep a list of what those maintenance items are. If you start doing this now, you’ll be way ahead of the game when you do decide it’s time to sell!
SEWER LATERALS AND DRAINAGE
Sewer Laterals and Drainage
We’ve had a number of office discussions about water-related issues since the first “atmospheric river” passed our way, and I heard something about sewer laterals that I wanted to pass along.
A sewer lateral is the underground pipe that takes wastewater from your home to the city sewer line. You probably know that when you sell a home in Berkeley, the sewer lateral needs to be brought up to current standards, either before or soon after a sale, unless there is a compliance certificate already on file.
The reason this is a requirement is not to address waste leaking from the laterals into the ground. Instead, the issue they’re targeting is rainwater entering through cracks in older sewer laterals, which is then carried to the wastewater treatment plant, where it can overwhelm the system.
At a recent office meeting, John Karnay (one of the owners of the Grubb Company) pointed out that some old, cracked sewer laterals could be functioning as de-facto French drains, letting rainwater in and carrying it away from the property. If that was the case, when the lateral is replaced, that drainage channel would be gone (because the rainwater can’t get in when the pipe is no longer cracked), and so it’s possible some properties with new laterals could see water building up in new places.
This is mostly theoretical, but it’s not a bad idea to keep an eye on your property’s drainage for a while after the sewer lateral has been replaced.
THE OUTLOOK: North Berkeley & Berkeley Hills, Summer 2021 wrap-up
I have been getting lots of questions lately about the state of the market, with people mentioning news articles that cite slowing. Our local market was not quite as crazy over the summer as it was over the spring, and that seems to be continuing into the fall. However, the spring was sooooooo crazy, that even with a little cooling, the market is still very solid.
****
BERKELEY HILLS
There were 96 active listings in the hills for the summer 2021 season (June through August), and 66 properties closed escrow. These numbers are up from the spring, which is not surprising — a big upward surge in prices generally inspires some sellers who were on the fence to list their properties. Properties sold on average after only 14 days on the market, which is quite fast.
The median sold price from June through August in the hills was $1,600,000. This is down a bit from the spring, but up 11% from last summer. A whopping 86% of the sales were for more than list price, which goes along with the low number of days on the market — most properties sold as soon as offers were accepted, with multiple offers. The average successful overbid was 20% over list price, and 10 of the sold properties went for 40 to 60% over list price.
The average sold price per square foot was $886 over the summer, which, like the median sold price, is down slightly from the spring, but still up 14% from last summer. As always, there was a big range. On the low side, three properties sold in the $400s per square foot (these were all large homes; the smallest was over 3600 square feet). 17 properties sold between $1000 and $1150 per square foot, and only two sold for more than $1150 per square foot. The highest sold price per square foot was $1562, for a property on San Luis. That property had many features that correspond with high price per square foot in our market: it’s a small (1184 square feet), architect-designed mid-century property, in the lower hills, on a larger lot, with panoramic views.
****
NORTH BERKELEY
There were 41 active listings in North Berkeley for summer 2021, and 34 properties closed escrow. These numbers are up from the spring, and there were also a relatively high number of condos and townhouses on the market over the summer. Properties in North Berkeley sold on average in 20 days on the market.
The median sold price from June through August was $1,582,500 in North Berkeley. This is up slightly (0.2%, or $2,500) from the spring, and up 20% from last summer. 71% of the sales were for more than list price, on average 29% above list price for those that went over. Six of the sales were for 40% or more above list price, up to a high of 67% over list.
The average sold price per square foot was $943 over the summer, which is down slightly from the spring, but still up 6% from last summer. There was a big range here too (similar to the hills). One large home (over 4000 square feet) sold for $418 per square foot, at the low end. 14 of the sold properties went for over $1000 per square foot, and of those, two went over $1500 per square foot. One was a 3-bedroom house on Virginia, which sold for $1505 per square foot, and the other was my two-bedroom listing at 1726 Francisco, which sold for $1586 per square foot.
****
So far this fall, we’re still seeing good buyer interest, with multiple offers on many properties— not as many offers per property as in the spring, but still enough to get great results for sellers. For buyers, it’s still a quite challenging market.
RESOURCEFUL
RESOURCEFUL
I try to recycle as much as possible, but I pretty frequently find myself staring at something trying to figure out what to do with it. I recently downloaded the “Resourceful” app to my phone, and I really like it! [If a phone app is not your thing, you can get the same information online at ResourcefulApp.com.]
On Resourceful, you can look at various products, and see recycling information that is specific to Berkeley, and also ideas for more sustainable alternatives. Resourceful also has a useful general guide to recycling in Berkeley. Here are a few tidbits about Berkeley recycling I picked up from the app:
(1) You should not put things smaller than your fist (approximately) in the recycling bin, because they can’t be sorted. However, caps to plastic bottles, if attached to the bottle, are okay.
(2) Compostable plastic (labeled #7, PLA, or compostable) needs to go into the compost bin, rather than the plastic recycling bin. If it gets mixed into the regular bin, it can contaminate the batch.
(3) Anything that consists of mixed material (like a disposable razor that’s plastic and metal) is not recyclable.
(4) Paper towels with food on them can go in the compost, but a paper towel with Windex or other non-compostable cleaning product on it has to go in the trash.
REAL ESTATE ANSWERS: What kinds of projects can add lasting value to my home?
What kinds of projects can add lasting value to my home?
Suppose you want to do some work on your home, and you want to choose a project that will add value, not just today, but into the future when you might sell your property. We all know that kitchens and baths sell houses, so remodeling either of those is an obvious possibility. However, if you have a long time horizon, there’s a problem with that choice: remodeling is very style-dependent.
If you remodel your kitchen now, but don’t sell your home for 15-20 years, you’re not going to get much return on the project, because your “new” kitchen will be pretty outdated by then. (Of course, there is value in the enjoyment you’ll get from having a great kitchen or a luxurious bath in the intervening years, so you might still want to do the project!)
Here are three things, though, that are unlikely to go out of style: (1) an additional bathroom, (2) more usable space, and (3) a great yard. The first of these is straightforward: another bathroom (especially if there is no bathroom on one level, or no bathroom attached to the primary bedroom, or only one bathroom overall) adds value.
Adding usable space can mean an expensive addition to your home, but it can also mean improving a basement, garage or attic, adding an ADU, or even adding a detached shed. Did you know that you don’t need a permit to add a single-story shed of up to 120 square feet (although you are supposed to have a permit if you add plumbing or electricity). Adding a nice shed is a relatively cost-effective way of gaining a little
more space to spread out, or adding a workspace, something many people are looking for these days. If you go with a nicer shed, incorporate it well into the yard, and maintain it over time, the next owner will appreciate it too (and pay more for the property).
A great yard, with nice plantings and spaces to play and hang out, also adds a lot of value. If you are (or you have) a great gardener, then well-chosen plantings that mature over time can make a garden feel special. If you’re not a great gardener, and you don’t think new plantings will last and look great in the long term, you can still improve your yard (and the value of your property) with space planning and some hardscape design. The goal is to fully utilize the yard space you have. Can you use the side yard to create a play area, or add storage or a place to tuck away trash and recycling cans to make more space elsewhere? Can you create a flat area on a sloped space, with nice stairs to it, to add a pleasant hang-out space? Can you add planting beds in a sunny spot, for herbs or tomatoes or something else?
I recently helped some lovely but extremely busy clients, who were not big gardeners, sell a property where the previous owners had done substantial landscaping on the property. Some of the plantings in the yard were not in great shape, but the layout and a few big plants were still there. We brought in a gardener, who cleaned everything up and added new plants, and the yard was magical again. These sellers had also added a shed/office in back, and the combination of the gorgeous yard and the little bit of additional space led to a fantastic sale price for the property.
If there’s a good chance you might sell in the next 10 years, then remodeling a kitchen or bath will have a higher return. Keep in mind this general rule though: the longer the time until you’ll want to sell, the more important it is to choose more classic finishes, rather than what’s bold and trendy right now.
THE OUTLOOK: North Berkeley & Berkeley Hills, Spring 2021 wrap-up
I am definitely a data-lover (I know that will not come as a surprise!), but I have been especially looking forward to analyzing the data for Spring 2021. The Berkeley market has been super hot since the start of the year, and the spring results are where that should show up.
****
BERKELEY HILLS
Over the spring season, there were 75 active listings in the hills, and 59 properties sold. These numbers are both higher than for Spring 2020 (not surprisingly, given that was the start of the pandemic shut-downs), and they’re also higher than in Spring 2019. Properties were on the market for 22 days on average, which is pretty typical. Not so typical were the prices. The median sold price from March through May in the hills was $1,675,000. This is an increase of 8.2% from the winter, and an increase of 11.7% from last spring. With relatively high inventory, these results are even more impressive. There were 8 properties that sold under $1M, and 6 of these were condos. 29 properties sold between $1M and $2M, and 22 properties sold above $2M. 78% of the sales were for more than list price, and those averaged 27% over list (almost double the average of 14% over list price last quarter). The average number of offers (when reported) was 7 per property, and the highest number of offers was 29, for a mid-century with great views and a level yard.
The average sold price per square foot was $899 this spring. This is up 12.5% from the winter, and up 23.4% from last spring. There was a huge range in sold price per square foot, from a low of $499 (for a fairly large, tenant-occupied property), to a high of $1430 (for the smallest single family home that sold).
****
NORTH BERKELEY
In North Berkeley, there were 33 active listings, and 25 properties sold during Spring 2021. These numbers are a little higher than last spring (not surprisingly, given that was the start of the pandemic shut-downs), and they’re pretty similar to Spring 2019. Properties were on the market for 27 days on average, which is on the high side, reflecting longer times to sell for a complicated fixer and 2 condos.
The median sold price was $1,580,000, which is an increase of 18.1% from last spring. 5 properties sold under $1M — 4 condos and a fixer. 16 properties sold between $1M and $2M, and 4 properties sold above $2M. 72% of the sales were for more than list price, and those averaged 30% over list.
The average number of offers, when reported, has been between 4 and 6 offers per property over the last several years. This number is up significantly this spring. The average number of offers for Spring 2021 was 9 per property, and the highest was 26 offers, for my listing on Grant Street.
Over the spring in North Berkeley, the average sold price per square foot was $967. This is an increase of 14% from last quarter, and up 5.8% from Spring 2020. Sold price per square foot ranged from a low of $594 (for the second-largest sold property) to a high of $1440 (for the smallest single family home that sold).
****
Interest rates remain very low, interest in Berkeley properties remains very high, and the business of real estate is gradually getting back to its pre-pandemic practices. Offices are mostly open, but many of us are still working primarily from home. The biggest change is that brokers’ tour and open houses are allowed again. Hope to see you out there one of these days!
A GREAT CAUSE
A GREAT CAUSE
Since as far back as I can remember, I have always loved libraries. When I was growing up, I loved the independence of wandering the aisles and choosing my own reading adventures. As a teen, the library was a safe and welcoming place to study and to meet up with friends. In college and graduate school, libraries were places to find answers, and spots of quiet serenity where I could get serious work done. As an adult, I borrow books all the time (although now I do it electronically, which I know is a controversial choice for the physical book-lovers among us!). Everyone should have access to these resources, both for their own entertainment and personal growth, and because access to information is essential for the proper functioning of our society.
For these reasons, and also to support my marvelous mother-in-law, who has been involved with the Friends almost as long as she has been in Berkeley, I just sent in a donation to support the Friends of the Berkeley Public Libraries. The Friends are a nonprofit organization whose purpose is to “support and expand the educational, cultural, and outreach programs of the Berkeley Public Library.”
If libraries are important to you too, you can join me in supporting the Friends by donating and/or becoming a member at www.BerkeleyLibraryFriends.org — click “Get Involved.” You can also help by buying or donating books at the Friends bookstore at 2433 Channing Way. See the website above for more details!
REAL ESTATE ANSWERS: What is the right pricing strategy for my home?
What is the right pricing strategy for my home?
In Berkeley and in the surrounding areas, it has long been the case that many properties are listed below what they’ll likely sell for. I’ll call this “low pricing.” Low pricing is a strategy intended to attract the attention of a wide range of buyers and to generate multiple offers. Most properties around here follow this strategy, but it’s not the only possibility.
“Transparent” pricing is a newer term for the classic pricing strategy followed in most other areas. It refers to choosing a list price that is at a value that the seller will accept for the home; the expectation is not that there will be a bidding war and the price will get bid up.
In deciding which of these strategies makes more sense for a particular property, the biggest consideration is whether there will be multiple interested buyers for the property. If you go with a low price and only get one offer, that offer may very well be at, or even below, the (low) list price. For this reason, for a property that is not something that a typical buyer is looking for (because of size, style, customization, etc.), or for properties in the upper price ranges (that are too expensive for most buyers), it makes sense to choose a transparent price. Listing a property low is only a good idea if there are likely to be multiple buyers bidding the price up.
For properties of broad interest, there are several reasons why the “price it low and generate bidding” strategy is beneficial. Multiple offers push up the price to the upper limit of what the buyers are willing to pay, so you know you’re getting top dollar. They also give the buyer with the winning offer confidence that the property is a good one (“If all these other people also want it, it must be good!”), and buyer confidence is important in holding deals together. Buyers may also waive contingencies they do not need and choose shorter time periods.
If you’re choosing a transparent price, the right price to choose is the market value of the home, determined by what other similar properties have sold for. If you’re pricing low, though, the inevitable question is “How low do you go?”
The most advantageous “low” list price is one that is similar to what other properties like yours are listed at. You want your home to look good relative to other homes that are for sale. If you list it at a price higher than similar properties, it will end up being compared by buyers to other homes that are bigger or otherwise more expensive, and it won’t compare favorably.
In normal times for this area, “low” list prices have been around 20-30% below market value. Lately, though, list prices are a lot further below market value. Why?
Sale prices/market values have shot up since the beginning of 2021, but typical list prices move more slowly. So far this year, homes are selling quite commonly for 30%, 40%, 50%, or even more above list price, up to double! Why haven’t list prices gone up as the market has risen? It’s a coordination problem. When other properties on the market are still choosing the same list prices as last year, a strategic seller will do the same, so that their home is compared by buyers to the right segment of the market.
THE OUTLOOK: North Berkeley & Berkeley Hills, Winter 2020-21 wrap-up
As always in the March/April newsletter, I’m going to review both the data for the past year, and also look at the winter quarter results (for December through February).
***
2020 Results:
2020 was a surprisingly solid year in local real estate, despite a big lull in activity with the first shelter-in-place. After just a few weeks, though, real estate was deemed an essential service, and activity gradually picked back up.
Berkeley Hills
150 properties sold in the Berkeley hills in 2020, which is a bit fewer than in 2019, but there were also fewer homes on the market. Properties sold in an average of 22 days (excluding the Spring Mansion at 1960 San Antonio, which was on the market for 1340 days). The median sold price in the hills was $1,500,000 for 2020, which is up 5.3% from the previous year. 70% of the sales were for more than list price, and those averaged 14% over list. The average sold price per square foot was $770, which is up 3% from 2019.
North Berkeley
A total of 88 properties sold in North Berkeley in 2020, in an average of 18 days on the market. This is more sales, with less time on the market, compared to the previous year. The median sold price in North Berkeley was $1,350,000, which is unchanged from 2019. More than 3/4 of the sales in 2020 were for more than list price, and those averaged 22% over list. The average sold price per square foot was $890, which is up 1.8% from 2019.
***
Winter Results (December 1, 2020 – February 28, 2021):
Berkeley Hills
The median sold price in the hills over the winter quarter was $1,547,500, which is up slightly (0.8%) from the fall and more significantly (by 9.8%) from last winter.
North Berkeley
There were very few sales in North Berkeley over the winter (only 8), so the data is heavily influenced by the characteristics of the properties that sold. 3 of the 8 sales over the winter were small (relatively inexpensive) condos. One of those condos was also a below-market-rate unit (BMR), which means that it must be sold for a restricted, pre-set price ($201,815 in this case). Because these small properties made up a big proportion of the sales, the median sold price over the winter was lower, at $1,195,000, which is lower than in either the fall of 2020, or the previous winter. Despite this data point, single family homes have been selling incredibly well so far in 2021, with loads of offers (we got 26 offers on my listing at 1726 Grant) at very high prices.
***
Interest rates have started creeping up a bit recently (to a little over 3% in many cases), but buyer interest remains intense right now, and the results for the spring season should reflect that!
REAL ESTATE ANSWERS: What is home fire hardening, and do I need to do it?
What is home fire hardening, and do I need to do it?
“We’ve learned from recent fires. Hardening your home and keeping the 5 feet closest to your house clear of flammable materials (including patio furniture and décor) greatly improves its chance of surviving a fire.” CALIFORNIA FIRE SAFE COUNCIL
Fire hardening is making changes to an existing home to make it more resistant to wildfire. According to the Fire Safe Council, your home can catch fire in 3 main ways: from ember storms, where small pieces of burning material are blown in front of a fire (embers can apparently travel more than a mile!) and create spot fires when they land; from radiant heat, where the heat from nearby burning plants or structures is so intense that it can ignite a house without direct contact (this is especially problematic in densely populated areas, where homes are close together); and from direct flame, which can enter a home when plants under windows burn, breaking the glass and allowing the fire inside the home.
If your home was built in 2010 or later, your home should be pretty “hard”, because building codes were changed then to include hardening requirements. Most of the homes around here are much older than that, but even if you have an older house, you’re not required make changes for the sake of fire hardening. It is worth considering, though, given the massive fires we’ve seen around the state in recent years.
Since the start of 2021, there is a new disclosure requirement related to fire hardening for sellers of properties that are located in a high or very high fire hazard severity zone (and that were built before 2010). Sellers of those properties are required to disclose to buyers if a home has certain features that make it more susceptible to wildfire and flying embers. The features are: (1) eave, soffit, and roof ventilation where the vents have openings in excess of 1/8” or are not flame and ember resistant; (2) roof coverings made of untreated wood shingles or shakes; (3) combustible landscaping or other materials within 5 feet of the home or under the footprint of any attached deck; (4) single pane or non-tempered glass windows; (5) loose or missing bird stopping (which closes off the open ends of tiles on a tile roof) or roof flashing; and (6) rain gutters without metal or noncombustible gutter covers.
You’re only required to disclose vulnerabilities that you know of, and only if the property is in a high or very high fire hazard severity zone, and of course only if you’re selling. However, it’s a good starter list for all of us to consider for improving the fire safety of our homes, even if they’re not going to be for sale.
A state map showing fire hazard zones can be found at https://egis.fire.ca.gov/FHSZ/. You can zoom in on Berkeley and find a specific property, or look at the boundaries of what they consider the red VHFHSZ (Very High Fire Hazard Severity Zone) area.
For more information on fire hardening, check out ReadyForWildfire.org.
HOW TO CHOOSE LED BULBS
HOW TO CHOOSE LED BULBS
I spend a lot of time looking at light fixtures and choosing bulbs, because replacing light fixtures is one of the most cost-effective ways to create an updated look in a home for sale. Choosing LED bulbs is surprisingly complicated, but here’s the step-by-step process that I use:
1: Figure out what shape bulb you need (including the size of the bulb and the type of socket).
2: Make sure to get bulbs for enclosed fixtures if your fixture is enclosed.
3: Choose the color temperature. (I always go for 2700K, which is like an old incandescent light, or 3000K, which is a bit whiter, like a halogen bulb.)
4: Choose the brightness (measured in lumens, but most bulbs also relate the brightness to that of old incandescents, like 60W, 75W, or 100W equivalents).
5: Look for bulbs with a high CRI (Color Reproduction Index). I always look for bulbs with a CRI of 90 or higher.
6: If the fixture is on a dimmer switch, make sure the bulbs are dimmable, and that your dimmer switch is LED-compatible (if it’s not fairly new, it probably isn’t).
It is very complicated, so you can also choose to avoid all this by going into a local lighting or hardware store, and getting someone knowledgeable to help you. Once you know what the right bulb is, it’s much easier to pick up replacements or order them online!
THE OUTLOOK: North Berkeley & Berkeley Hills, Fall 2020 wrap-up
I find this sort of amazing given what’s been going on in the world this year, but our real estate market has continued to do remarkably well through the fall season. The combination of super low interest rates and the desire to have a better space to shelter in has kept demand from buyers strong. At the same time, fewer property owners have put their homes on the market — for Berkeley as whole, the number of homes for sale from January through November this year was down 14% compared to the same period last year.
With low supply and high demand, it’s not surprising that we’re seeing high prices and a strong seller’s market. Note, though, that condos (where you may share outdoor spaces or an elevator with other people) and multi-unit properties (which are challenging in this environment where tenants may not be able to pay rent) are not faring as well.
***
Berkeley Hills, Fall results:
There were 81 active listings in the hills from September through the end of November, which is actually on the high side of normal despite the year-to-date figures for Berkeley as a whole. 53 properties sold, in an average of 40 days on the market. 40 days on the market is a long time for our area, but looking at the data, the reason is quite clear. 1960 San Antonio (commonly referred to as “The Spring Mansion”) sold this fall after literally years on the market. The fact that that property finally sold says something about the strength of the market, but it’s also an extremely unusual property (if you’re not familiar with it, it’s a 12,000 square foot historic fixer), so its time on the market is an outlier. Leaving that data point out, the average days on the market was only 15. Three quarters of the fall sales were for more than list price, and those that went over averaged 14% over list. 5 of the 53 properties that sold had price changes (4 reductions and 1 increase) before finding a buyer.
The median sold price in the hills was $1,535,000, which is up 6.6% from the summer, and up 8.6% from Fall 2019. The average sold price per square foot was also higher at $786, up 1.1% from the summer, and 7.8% higher than last fall.
***
North Berkeley, Fall results:
There were 40 active listings in North Berkeley from September through the end of November, which, like in the hills, is slightly on the high side of normal (making up a bit for earlier in the year). 32 properties sold, in an average of 18 days on the market. 81 percent of the fall sales were for more than list price, and those that went over averaged 24% over list. 2 of the 32 sold properties had price reductions before finding a buyer.
There were 3 condos in the sales this fall, and these three all sold quickly and above list price. There are others, though, that have been sitting on the market well beyond the typical two weeks.
The median sold price in North Berkeley over the fall was $1,388,750, which is up 5.2% from the summer, and up 3.8% from Fall 2019. The average sold price per square foot was also higher at $920, up 3.6% from the summer, and 9.2% higher than last fall.
***
Usually, the market slows down substantially in December and January, but that doesn’t seem to be the case so far this winter. With fewer people traveling, we’re not seeing the usual dip in activity, and winter seems to be shaping up to be another very strong quarter.
Sending you all my best wishes for the holiday season and the new year — stay safe, stay healthy, stay sane, and here’s hoping we’re all able to get back to the people, places and activities we love in 2021!
LOW RATES & HIGHER CONFORMING LOAN LIMITS
LOW RATES AND HIGHER CONFORMING LOAN LIMITS
Interest rates are low, low, low right now! As I write this, the 30-year fixed rate is lower than it’s been since Freddie Mac began tracking mortgage rates in 1971.
While it’s not surprising that rates are low given the economic impacts of the pandemic, it is still an opportunity for both buyers getting new loans and homeowners who can refinance their existing loans. Fixed rate 30-year conforming loans (up to the loan limits discussed below) can in many cases be had for under 3%. Even larger-amount jumbo loans, which were challenging to get and much more expensive earlier in the year, are available around 3%.
The loan limits for conforming loans (those that meet the funding criteria of Freddie Mac & Fannie Mae) are set to go up again in 2021. The Federal Housing Finance Agency determined that home prices nationwide rose an average of 7.42% from the third quarter of 2019 to the third quarter of 2020, so loan limits will be increased that same amount (7.42%) for the coming year. In high-cost areas like ours, that means the limit for single-family homes will increase from the current $765,600 to $822,375 in 2021.
THE OUTLOOK: Berkeley (North & Hills), Summer 2020 wrap-up
Between the pandemic, the wildfires, and the blanket of smoke we’ve had to live with lately, one would think that the local real estate market would have gone into hibernation, but this has not been the case. The pandemic has caused many people to re-evaluate where they want to live. We’ve been spending much more time in our homes— for work, for school, for meals, for entertainment, for exercise, for leisure— so having the right indoor and outdoor spaces for those activities is more important than ever.
Many people working from home are moving to take advantage of lower real estate prices and bigger yards in more remote locations. While that has meant that some people have left Berkeley for more rural spots, we’ve also seen more people than ever leaving San Francisco for Berkeley. Overall, there have been more than enough new Berkeley buyers in the market to balance flows out of our area, and we’re still seeing quick sales, solid prices, and multiple offers on many properties.
***
Berkeley Hills, Summer results:
There were 61 active listings in the hills this summer, which is actually on the high side, but this is because some of what would have been spring sellers delayed coming on the market. There were 101 active listings in the hills for spring and summer together, compared to 115 listings for spring and summer of 2019. This summer, 29 properties sold, in an average of 25 days on the market. Two-thirds of those sales were for more than list price, and those averaged 8% over list.
The median sold price in the hills was $1,440,000, which is down from both this spring (by 4%) and last summer (by 8.2%). However, sold price per square foot was $778, which is 6.8% higher than the spring, and 1.1% higher than for summer 2019. When these two measures (median price and price per square foot) move in opposite directions, it means that the mix of properties sold was different between the time periods (in this case, there were more small homes in the data this summer).
***
North Berkeley, Summer results:
In North Berkeley, there were 36 active listings over the summer, which is high for this area (last summer there were only 23 active listings), but again, this is because some homes that would have been listed during the spring didn’t actually come on the market until the summer. There were 30 properties that sold over the summer in North Berkeley, in an average of 19 days on the market. Four out of five of those sales (80%) were for more than list price, and those averaged 18% over list.
The median sold price for the summer was $1,320,000, which is down 1.3% from the spring, but up 2.3% from last summer. Sold price per square foot averaged $888, which is down from both the spring (by 2.8%) and from last summer (by 5.1%). There were 6 properties that sold for more than $1000 per square foot, and 4 that sold for less than $700 per square foot. The lowest was $512 per square foot for a tenant-occupied fixer on Marin.
***
Because of the pandemic, we’re seeing less demand for condominiums and tenant-occupied properties right now, but in both North Berkeley and in the hills, values for other types of properties are stable, or even up very slightly from last year. Interest rates continue to be historically low, which should keep the market strong through the end of 2020.
ARE YOU UNDER-INSURED?
ARE YOU UNDER-INSURED?
The huge wildfires this year are a reminder that we should all periodically evaluate our insurance coverage, and make sure that we could rebuild if we ever needed to. Most insurance policies auto-renew each year, and the coverage may not keep pace with rising building costs.
To get a very rough sense of the adequacy of your existing coverage, take your total coverage amount and divide it by the square footage of your home to calculate how much you would be able to spend per square foot if you had to rebuild. Experts say that $250-$300 per square foot is the minimum likely cost to rebuild in our area, so I would want to have at least that much coverage.
Also check to be sure that you’ve updated your policy to reflect improvements you’ve made to your home, and that you have coverage for any external structures.
Now, while we’re staying home, is also a good time to do a home inventory, which helps a great deal if you ever have to file a claim for a major loss. You can find forms online to fill out where you list the contents of your home, or you can take photos or video of your rooms, closets and other storage areas, showing the contents. Keep a copy of the information away from your home (ideally somewhere online), so you can get it if you ever need it. (Let’s hope we never need it!)
For more information on doing a home inventory, see
https://www.iii.org/article/how-create-home-inventory
Here’s also one example of a spreadsheet for doing a home inventory:
https://www.nycm.com/pdf/HomeContentsInventoryWorksheet.pdf
THE OUTLOOK: Berkeley (North & Hills), Spring 2020 wrap-up
I’m going to shift focus somewhat for this issue of The Outlook. We’re living in a time right now when many of our usual concerns seem trivial. Compared to the importance of the growing calls for an end to systematic racism and violence against black people and reforms in the way we police our communities, and compared to coping with a global pandemic and its effect on our lives and livelihoods, real estate market statistics seem like a side note.
However, there are a variety of reasons why people still want to know what’s happening in the local real estate market. Some people need to make a move, and others, given all the economic uncertainty we’re living with today, would like to know the status of what may be their biggest investment. For those people, and for anyone who might be curious, I’m going to give a rundown on how the market is doing in these uncertain times.
I will get into the actual data for both North Berkeley and the Berkeley Hills shortly, but overall, the market is doing surprisingly well, with a lot of adjustments for current circumstances. Some buyers have dropped out of the market, but there are also fewer listings, so these things have balanced each other out and we haven’t seen significant changes in values. We always have a good number of buyers from San Francisco, and this is even more true now. With so many people working and spending more time at home, the desire for more space and a private yard is greater than ever.
Safety and Marketing in the time of COVID-19
The real estate community as a whole has been very focused on keeping everyone safe. The biggest change in how we do business is that there are, of course, no gatherings: no in-person open houses, no in-person brokers tours, no in-person office meetings. Our office meetings and brokers tours are now online Zoom meetings, which allow agents to network and share information while everyone stays safely at home. Listing agents are making more information available online, so that buyers can evaluate properties and decide what they’re seriously interested in without leaving home. There are far fewer people walking through homes that are for sale, which I think is a good thing from a public health perspective. From a marketing perspective, this has not hurt the process, because it’s the people who are not actually thinking of buying a property who are not seeing it in person.
Serious buyers can and are still touring homes, but there are specific protocols that are followed for everyone’s safety. All showings are by pre-arranged appointment with an agent, so that only one party is at the property at a time. Only two people from the same household can visit a property at one time, and all visitors sign a disclosure about safety, risk, and protocols up front. Masks are worn, 6-foot distancing is maintained, everyone uses hand sanitizer, and properties are cleaned before and after showings.
Spring market data, North Berkeley
During the spring season (March through the end of May), there were 30 active listings in North Berkeley, and 20 closed sales. Both of these numbers are lower than the previous spring, when there were 36 active listings and 25 sales, but not by as much as one might think given the circumstances. On average, properties sold in only 10 days on the MLS.
The median sale price in North Berkeley for the spring was $1,337,500, which is down 3.6% from Spring 2019. However, the average sold price per square foot was up 10% from last spring, at $914 per square foot. One property had a price reduction before it sold, one property increased its price, and 3 out of 4 properties sold above list price. For the properties that sold above list price, the average was 25% over asking.
Spring market data, the Berkeley Hills
For Spring 2020, there were 40 active listings in the Berkeley hills, and 28 closed sales. These numbers are significantly lower than usual; a year ago in the spring there were 73 active listings and 46 sales. Properties in the hills sold on average in 21 days on the MLS.
The median sale price in the hills for the spring was up 3.6% from Spring 2019 at$1,500,000. The average sold price per square foot was $729, which is up slightly (1%) from the winter season, but down 5.6% from last spring. Five of the sold properties had price reductions, but 7 out of 10 properties sold above list price. For the properties that sold above list price, the average was 13% over asking.
The summer season looks like it could be more active than usual in both the hills and in North Berkeley. Market activity usually slows a bit over the summer, as many buyers are out of town traveling, and for that reason, not as many listings come on the market. This year, however, people are not doing much traveling, so the buyers are around, and there are a good number of sellers who delayed coming on the market in the spring.
Fair housing
I want to end by acknowledging the continuing demonstrations against violence and bias against blacks in policing, and more broadly against systematic bias and racism in general. The housing industry has a horrible history of systematic racism. I would like to think that it has been vastly better since the implementation of fair housing legislation, in California with the 1959 Fair Housing and Employment Act and the 1963 Rumford Fair Housing Act (thank you, William Bryon Rumford, whose statue sits on the median of Sacramento Street at Ashby), and nationally with the Fair Housing Act of 1968. In the realm of California home sales (which is the part of the housing market I see directly), I think the fair housing laws have been pretty effective, both because of ongoing training throughout the real estate community, and because of ongoing vigilance and enforcement. There is however still work to be done, and the legacy of past discrimination lives on in many ways, including in the wealth gap between black and white Americans. [See for example https://www.epi.org/blog/housing-discrimination-underpins-the-staggering-wealth-gap-between-blacks-and-whites/ .] I hope that, in time, we can look back at the current protests and see that they led to not only widespread and honest self-examination, but also lasting and meaningful change at a societal level.
REAL ESTATE ANSWERS: Why should you pull a permit for work done on your home?
Why should you consider pulling a permit for work done on your home?
The #1 reason you should get a permit if you’re having work done on your home that requires it is the obvious one: it’s required by law, and you can have problems with the City if they discover you don’t have a permit, either as the work is being done, or after the fact. That said, it’s definitely the case that many homes in our area have work that was done without permits. Homeowners choose to skip permits for a variety of reasons, including the cost of a permit, the additional property taxes that might be triggered, the possibility that the work might not be allowed by the city for zoning or code reasons, etc..
Here are the top three reasons to consider getting a permit, though, beyond just that you’re supposed to do it:
(1) It’s good to have an external check on the work being done. Note that having a permit and the related inspections is not a guarantee that everything is done correctly, but at least someone with some knowledge is looking things over.
(2) If you’re adding square footage, and/or bedrooms and baths, the new space won’t have as much value in a sale if it is not permitted. An appraiser looking at a property doesn’t give full value to space if it’s not included in the public record and you can’t show that it was added with permits. Likewise, buyers may not value the space as highly because of potential issues with the appraisal, and because they may be uncertain about the quality of the work done.
(3) A permit sets the clock for the building code when the work is done. Suppose you add a bathroom without a permit, and the city discovers this at some later date. Possible outcomes could be that they require that the bathroom be removed, or that the work be inspected and brought up to current code and requirements. Even if the work was done really well, and complied with all building codes and zoning requirements at the time it was completed, those codes and requirements may have changed, and past work without a permit is not “grandfathered in” (i.e. allowed to stay because it conformed with past regulations). And, even if the codes or zoning have not changed, you still might be required to open up walls and undo things so that the underlying work can be inspected.
To permit or not to permit? I leave you to decide. One last thought though. If you are having work done with a permit, be sure to follow up with your contractor, and get a copy of the final inspection sign-off after the work is done. When I look at the online permit record for a particular property, I often see records for permits that were pulled, but never finaled. Sometimes the work was not completed, but many other times, the final city inspection was never done, or the city’s database doesn’t show that final inspection. By getting a copy of the final sign-off from your contractor, you know that the final inspection was done and passed, and you can prove it if something gets lost in the city records.
Home Loans, Interest rates, and Real Estate Newsletters
HOME LOANS AND INTEREST RATES
x Interest rates on home loans have been very low lately! If your interest rate is close to, or above, 4%, it could be worth your while to contact your favorite loan person and see if you could benefit from refinancing your loan. x (See the update below.)
Also, the limit on conforming loans (which can be sold to Fannie Mae and Freddie Mac) in our area was increased for 2020 to $765,600, up from $726,525 last year. Loans below that limit often have lower interest rates than those above.
UPDATE, March 20, 2020
While the Fed has cut interest rates multiple times, and the interest rate on 10-year Treasury notes (which is typically the rate most tied to rates on home loans) has fallen substantially since the beginning of the year, home loan rates have actually risen. Lenders reportedly were already struggling to keep up with refinance requests, and these difficulties cannot have been helped by the Shelter-in-Place. I suspect rates will come down later in the year, but for now, they’re on the high side compared to both recent history, and underlying factors.
In the news: (This is a big one for everyone who has been worried about making ends meet during these challenging times! Fingers crossed that this actually is a readily accessible option…) If you have a conforming loan, guaranteed by Fannie Mae or Freddie Mac, the government, in response to the pandemic, has said that you should be eligible to have your mortgage payments reduced or suspended for up to 12 months. For more information, see https://www.npr.org/2020/03/19/818343720/homeowners-hurt-financially-by-the-coronavirus-may-get-a-mortgage-break
ON A SEPARATE NOTE…
There are a lot of real estate newsletters (electronic and printed) out there, but did you know that most of them are produced by an outside party, with a more regional focus so that they can be more broadly used?
I’ve been writing the Berkeley Hills Report (myself) now for 13 years. I create and review the data so that I can focus on our immediate area and get a deep sense of what’s happening in the market. (My PhD is in economics, so this sort of analysis is right up my alley.) I write this newsletter so I can share this information with you, and at the same time give you a good sense of who I am and what I bring to the table. I hope you find it useful!
REAL ESTATE ANSWERS: I’m considering selling my home next year. What should I start doing now to get ready?
I’m considering selling my home next year. What should I start doing now to get ready?
It’s a well-known fact that right now is not the optimal time to sell a home in our area. It is, however, the right time to start getting things in place if you’re thinking of selling next year, so that you’re ready for the very busy selling season. Here are the first things to do to get ready.
(1) Think about where you’ll be when your home is on the market. Do you already have your next home set? Are you renting or buying the next place? If you’re buying, do you need to sell before you buy? (This is a question most people need to explore with a good loan professional.) If you’re going to sell before buying a new home, will you be moving to a short term rental, or will you be living in the home when it is for sale? Most sellers in our area move out before selling. It’s not required or absolutely essential, but it makes the process of preparing the home for sale, and of showing it looking its absolute best to prospective buyers, much easier.
(2) Choose your timetable. When will your home come on the market? The schedule will depend on the timing of any preparation work to be done, and should factor in the best time to hit the market. For
some homes, that’s during the busy spring season. For other properties, it may be better to be a bit earlier, when there are fewer other homes on the market.
(3) Hire the right stager (well in advance). Great staging will bring top dollar in a sale, but it needs to be the right staging for your particular home. Bad staging is a waste of money, while good staging pays for itself many times over with a higher sale price. The best stagers book far in advance, but they’re worth planning ahead for! Also, a good stager will suggest improvements to the property that will add value, and choose colors and finishes so that the final look is cohesive and attractive to buyers.
(4) Do non-cosmetic repairs now. Cosmetic improvements and painting are best done in consultation with the stager, usually just before the home hits the market. If, however, there are functional repairs that you know are needed (for example, an electrical issue, a leaking skylight, rodents in the subarea, dual pane windows that have fogged) that will affect buyers’ perception of your home, now is a great time to get those repairs done. If the repairs require choosing surfaces or fixtures (for example, replacing a light or a faucet), the stager can help choose the best reasonably-priced but stylish options.
(5) Decide what needs to be repainted, and choose a painter. Painters, like stagers, get booked up early in the months leading to the busy spring selling season.
(6) Hire a great agent who specializes in your area. Your agent can help you with steps 1 to 5 above, and also get you ready for the next steps. If you’d like to see all the steps in selling a house, email me at marilyn@marilyngarcia.com, and I’d be happy to send you the detailed list!
Bridge Loans
BRIDGE LOANS
Did you know that it’s possible again to get a bridge loan? A bridge loan is a short-term loan that can be used to access the equity in a home you are planning to sell in order to purchase a new home.
Following the financial crisis in 2008, lending standards got extremely strict, and bridge loans vanished from the market. Non-cash buyers who wanted to buy a new home before selling their old one needed to either (1) show that they had enough income to make payments on the loans on their existing home and on their new home indefinitely, or (2) they needed to show a signed lease for their old home, covering enough of the carrying costs for that property. Now some lenders will review the loan application taking into account that the borrower is only planning to own both homes for a short period of time.
Not every lender offers this type of loan, and they don’t make sense for everyone, but I do know of a couple very good local loan people who can offer a bridge loan. (I’m happy to send you their contact information if you’re interested.) There are still, of course, qualification requirements including a good amount of equity in your old home, but you no longer need enough income to pay your new and old mortgages indefinitely, and you no longer need to show that you have leased your old home.
REAL ESTATE ANSWERS: Why do list prices sometimes increase after a property has been on market for a while?
Why do list prices sometimes increase after a property has been on the market for a while?
In most parts of the country, properties come on the market, and if they don’t sell after a period of time, motivated sellers will reduce the list price to attract buyers. Around here, if a property is not getting the interest the seller hoped for, sometimes the seller will reduce the list price, but other times the list price will increase. What’s going on?
The answer lies in the strategy that was followed in choosing the original list price. In other areas, the typical strategy is to choose a list price around market value, or sometimes a little above market value “to leave room to negotiate.” If the property doesn’t sell after a certain period of time, that’s a signal that the list price is too high, so the right response is to reduce the price.
Around here, things are more complicated because there are different strategies for choosing the list price. Some properties follow the strategy I just described, going with a list price at market value. This strategy makes sense for properties where we don’t necessarily expect there to be multiple offers, perhaps because the price point is high, or there’s something specific about the property that the right buyer would find appealing, but that wouldn’t work for everyone. For properties where the list price is around market value, the correct response if they don’t sell in a reasonable amount of time is a price reduction. (Note that “a reasonable amount of time” in this case might be somewhat longer than the two-week marketing period we often see in Berkeley, because with this strategy, you’re waiting for the one right buyer to come along.)
The other strategy, which is of course the most common one in Berkeley, is to choose a list price that is below market value, to attract multiple offers and competitive bidding on a specified offer date. What if a seller chooses a low list price, but doesn’t get any offers on the offer date, or gets just one offer at the low list price? In this case, one reasonable response is to increase the list price. After the offer date passes, the likelihood of getting multiple competing offers is quite low. Sellers in this case can switch to the other list price strategy, and increase the list price to market value. Note that there probably is some information in the fact that the property didn’t get multiple offers, and that information should be taken into account in choosing the new price.
The right list price strategy for a particular property depends on the characteristics of the property itself, and how the market is doing. Choosing the right list price is key. The houses that are priced correctly from the start are the ones that sell quickly and for the most money.
Emergency Alerts
EMERGENCY ALERTS
Have you signed up yet for Alameda County emergency alerts? The system is called AC Alert, and it’s very easy to sign up to receive notifications from city and county agencies in the case of an emergency. Just go to ACalert.org online, and you can sign up to receive notifications by voice message, text message and/or email.
The City of Berkeley previously used an alert system called BENS, but this system is no longer active, and subscribers to BENS are not automatically signed up for AC Alert.
There are other alert systems that have slightly different focuses. I signed up a while ago for Nixle (used by the Berkeley Police Department), and have received a variety of messages about things like missing persons, road closures, and crime alerts. To sign up for text message alerts from Nixle, you just text your zip code to 888777. You can also get email alerts from them by signing up at nixle.com. UC Berkeley also has an alert system, called WarnMe.
Even if you are signed up for Nixle or WarnMe, though, the City of Berkeley says that you should also sign up for AC Alert, which is the City’s primary emergency notification system.
REAL ESTATE ANSWERS: How have the massive fires in recent years affected homeowner’s insurance locally?
How have the massive fires in recent years affected homeowner’s insurance locally?
I spoke with Ruth Stroup with Farmers Insurance, who is always a great source of information about the insurance world, and asked her what changes she’s seen as a result of the tragic fires we’ve had in California over the last few years.
Ruth said that the huge claims in back-to-back years from the fires have affected insurance companies’ ability to get reinsurance. (Reinsurance pays a share of the claims in the case of massive losses like with the fires, and is a critical component of the insurance business.) As a result, many of the big-name insurance companies are not selling new policies in high-risk locations.
Insurers use a scoring system that evaluates how much risk of loss there is in a particular location. A property is given a risk score based on characteristics like accessibility (how easily fire-fighting equipment can get to a property—Ruth said this is the biggest factor), slope, and the amount of fuel nearby.
New insurance policies are available for properties with high risk scores, but one has to go to a specialty insurer, at a much higher cost. Ruth has not seen any issues of this type for properties in the Berkeley “flats,” where the lack of slope, easier road access and fewer areas of dense vegetation lead to more favorable risk scores. This can, though, be an issue right now for homes in the Berkeley hills. (If you live in the hills, this is probably not the time to shop for a new insurance carrier!).
Ruth recommends that everyone periodically review their insurance policy, to make sure you have enough coverage. Building costs have increased substantially in recent years, so it’s important to make sure your replacement value reflects that. Ruth also suggests that everyone check the endorsements on their current insurance, to see if you have enough coverage for building code upgrades. She recommends getting building code upgrade coverage of at least 25%, due to newer ordinances that would require expensive improvements if you had to rebuild, such as interior sprinklers, greater seismic resistance and higher energy efficiency.
I live in the hills, so I asked Ruth how much it would cost to insure my house, if I were buying a new insurance policy today. My home’s risk score turned out to be on the low side for the hills (there are some wide and fairly straight roads between me and the nearest fire stations), but she still estimated that a new policy would cost me double what I am now paying. I think some of that additional cost is the current situation, and some is probably that I am underinsured in light of higher construction costs. Time to call my insurance agent!
I’VE MOVED!
I’VE MOVED!
After 16 years with the same brokerage, I decided it was time to make a change, and I’m delighted to share that I’ve joined The Grubb Company!
I chose The Grubb Company after lots of information gathering, and discussions with various brokerages. The Grubb Company was the clear choice, because of their longstanding commitment to our area (they have been in business for over 50 years), their excellent market share, their commitment to quality, the fantastic support staff, and most importantly, the caliber of the agents. The average agent at The Grubb Company does more business (measured by number of transactions or by dollar volume) than at any other brokerage in the Bay Area. My new colleagues are wonderful, and their collective knowledge is a great additional resource for me in helping my clients.
My contact information remains the same, as does my focus on the North Berkeley and Berkeley Hills markets. As always, don’t hesitate to get in touch if there’s anything I can do, whether you’re thinking of buying or selling, or just have a general question. I’m always happy to hear from you!
UC BERKELEY: MORE ACCOLADES!
We already know that UC Berkeley is one of the top universities in the world, but I still love to see it getting the recognition it deserves. In the latest rankings of graduate programs by US News & World Report, there were many Cal programs that were among the top-rated.
Cal was ranked #1 (or tied for #1) in Biological Sciences, Computer Science, English, Psychology and Sociology. I was especially excited to see the graduate program in Economics (which is where I got my PhD) also tied for the #1 position!
Other Cal graduate programs that ranked in the top ten included: Chemistry, Earth Sciences, Mathematics and Public Policy Analysis, all at #2; Engineering and Physics, both at #3, Environmental Policy and Management, History and Political Science, all at #4. The business school was tied for #6, and the law school was tied for #10.
There are lots of other top-ten results. If I haven’t mentioned your favorite, check out the full rankings online at: www.usnews.com/best-graduate-schools.
REAL ESTATE ANSWERS: How old is the housing stock in Berkeley?
Many times over the years, when counseling new buyer clients, I have pointed out that the majority of the homes in Berkeley are older, built in the early part of the 1900s. I know this anecdotally, and from looking at so many homes over the years, but I had not seen any actual figures. I thought it would be interesting to look at the data, so I went to my handy public records database and looked at records for the single family homes in Berkeley.
A couple things to keep in mind: (1) I only looked at structures that are currently listed as single family homes in the database. Homes that have been converted to business use, or to condos or apartments, or that were destroyed over the years, are not included. (2) The numbers that follow are derived from information from the public records database, but the data there is not completely accurate. Please take all these numbers as approximations, to give a sense of the magnitudes, rather than exact counts.
The total number of single family homes in the database for Berkeley is 17,682. The 7 oldest homes listed in the data have a “Year Built” of 1880. I was surprised to see that these 7 homes are scattered around Berkeley. I expected most of the oldest homes to be in the Oceanview area, but I think many of the historic properties there are no longer single family homes.
The next oldest homes in the current Berkeley housing stock are the 198 homes built from 1881 to 1900. Building in Berkeley increased substantially after that, giving us 5502 single family homes built from 1901-1920. The greatest concentration of homes in our current housing stock were built between 1921 and 1930 (6327 homes). The Bay Bridge opened in 1936, but by then the biggest wave of construction had already passed. Today, the City of Berkeley has 3140 homes that were built from 1931-1950, and the number of homes built per decade tapers from there.
Overall, the average “year built” of the single family homes still in existence (according to this database) is about 1930, so that gives us the answer. Our stock of single family homes is, on average, approaching 90 years old!
REAL ESTATE ANSWERS: What’s changing as a result of the Berkeley measures on the 2018 ballot?
There were 2 local measures on the November 2018 ballot that were approved by voters that will impact local real estate going forward.
The first was Measure P, which passed with 72% of voters saying yes. Measure P increases the Berkeley city transfer tax on property sales at prices over $1.5M, from 1.5% of the sale price, to 2.5%. Property sales at prices of $1.5M or less will still be taxed at the old rate of 1.5%. The measure says that the funds raised are intended to be used for “general municipal purposes such as navigation centers, mental health support, rehousing and other services for the homeless, including homeless seniors and youth.” It also establishes a Homeless Services Panel of Experts to recommend services.
Berkeley now has the highest transfer taxes in the state except for properties that sell for more than $10M in San Francisco or Richmond. San Francisco properties that sell for less than $10M have a lower transfer tax than in Berkeley. In Richmond, properties selling for less than $3M have a lower transfer tax, and properties in the $3M-$10M range match Berkeley’s 2.5% tax.
As a result of Measure P, I think we’ll be seeing a real discontinuity in the market at $1.5M. The difference between a sale at $1,500,000 and a sale at $1,500,001 is an extra $15,000 in transfer taxes! I expect that a lot of buyers who might have made an offer in the low $1.5M range will decide instead to not go over $1.5M. Since the city transfer tax is typically split 50/50 between the buyer and seller, both parties have an incentive to keep a sale price under that figure. Buyers will be trying to find creative ways to sweeten their offer in a multiple-offer situation without crossing that threshold. For properties valued well above $1.5M, the buyers will just have to factor in the higher costs (and the sellers the lower proceeds).
The other local real estate measure that passed was Measure Q. Measure Q was written to address how Berkeley rent control would proceed if the statewide proposition to repeal the 1995 Costa Hawkins Rental Housing Act passed. The statewide proposition did not pass, so Costa Hawkins is still in effect and most of Measure Q ended up being not relevant. (You likely saw this when you voted in November, but if you’d like a refresher, Costa Hawkins most notably prevents rent control from being imposed on single family homes and condominiums, allows rents to be reset to market rates when a unit is rented to new tenants, and prevents rent control from being imposed on units constructed after February 1995.)
However, one part of measure Q, intended to encourage construction of new accessory dwelling units (ADUs), will go into effect. For properties with one legal and permitted ADU, if the owner resides on the property, the rental unit will be exempt from rent and eviction controls. The exemption will apply to tenancies that started November 7, 2018 or later.
FREE STUFF (How to give it away)
I am a big fan of a good purge, and the new year is a great time to get rid of unwanted stuff. At the same time, I hate to throw anything away that someone else might be able to use, and non-profit donation centers only take certain items.
For things that can’t be donated, I give them away using Freecycle, Next Door or Craigslist. I don’t want to just leave things at the street until someone takes them — it’s unsightly, and the items can get dirty, or wet. I often don’t have time to coordinate schedules with people who may or may not ultimately want the item, though, so here’s my strategy. I wait for a non-rainy day when I am mostly at home. I take lots of photos of the item, including the flaws, and post them (usually using Craigslist’s “free stuff” section: Go to post.craigslist.org, choose your location, choose “for sale by owner,” then choose “free stuff” ), including measurements and as much information about the item as I have. I do not include a phone or email contact, but say in the posting that I will leave the item at the curb (giving the address), and that I will remove the posting as soon as I see that the item is gone. I then periodically check to see if the item has been taken, and remove the posting as promised.
This has worked really well in the past. Things I have passed along in this way include an old washing machine, a broken printer, a cool leaded glass window (broken and warped), and a somewhat rusty charcoal grill. It makes me feel good that the items are going to someone who can use them rather than to the trash heap!
Go UC!
Money magazine just released their latest ranking of colleges and universities, and the University of California got 5 of the top 11 spots! Wow! To come up with the rankings, Money combines measures of “Quality of Education” (based largely on graduation rates), “Affordability” (net costs after financial aid, borrowing, time to graduation and student loan repayment rates) and “Outcomes” (measured mostly by alumni salary data).
UC San Diego ranked 2nd overall, after only Princeton University. UC Irvine was 3rd, UCLA came in 4th, UC Berkeley was 7th, & UC Davis was ranked #11. One can definitely quibble about the order, the criteria and even the validity of these types of rankings in general. I am definitely biased, but I am not convinced that there are 3 UCs that are better than Cal! I also don’t think average salary is a great measure of outcomes. Nonetheless, it’s clear that the University of California system is doing something right, and is something to be proud of.
Forbes Magazine also just released their own annual rankings of colleges, with different criteria that also yielded incredibly impressive results for the University of California. For 2018, UC Berkeley was #1 in their list of the top 25 public colleges (that’s more like it!). UCLA was #8 on this list, UC San Diego was #18, UC Santa Barbara was #19, UC Davis was #21, and UC Irvine was #22. UC Berkeley also ranked #14 on their overall list of best colleges (including public and private institutions). This is all really well-deserved recognition!
The full lists, and more information about the methodology used for these rankings can be seen online at
and
REAL ESTATE ANSWERS: Why are there so many wild turkeys around these days?
This is not exactly a real estate question, but it is something I have been really wondering about myself! When I was growing up, I don’t remember ever encountering a wild turkey. Now it seems they’re everywhere, not just in the Bay Area, but in other parts of the country as well. A quick google search turns up articles about the abundance of wild turkeys in Massachusetts, Alabama, Chicago, Tennessee, Ohio, and lots of other places. Just a few days ago, I sat in my car at a stoplight and watched a gang of turkeys cross Marin Avenue at the very busy intersection of San Pablo. They were even using the crosswalk!
An article from last November in the Washington Post (not surprisingly, published just before Thanksgiving) talks broadly about the history of wild turkeys in the U.S.. Wild turkeys were abundant at the time when the first European settlers landed, although they were supposedly not on the menu at the first Thanksgiving dinner. Over time, unrestricted hunting decimated the wild turkey population, until the early 20th century when there were only about 200,000 wild turkeys in the lower 48 states, living mostly in remote areas. Conservation efforts began after World War II, and they became very successful when they started trapping wild birds and relocating them to areas with “turkey deficits.” The wild turkey population rebounded, reaching a high of 7 million in 2004. Wild turkey numbers nationally have since fallen to about 6 million, but it doesn’t seem like the numbers are going down in this area!
More locally, an SFGate article suggests that extended drought in past years led turkeys to move from dry wilderness areas to irrigated urban areas. So even though the total wild turkey population has gone down nationally, we are seeing more of them in the Berkeley area. Once the turkeys have moved to a more urban environment, they thrive, with few predators and limited (or no)hunting.
The Washington Post and SFGate articles are available online:
https://www.sfgate.com/news/article/wild-turkeys-California-depredation-permit-poop-12309195.php
Your Real Estate Expert for Berkeley and Beyond
“Marilyn is exceptional. Her knowledge base, enthusiasm for her job, professional ethics, organization, sensitivity to our aesthetic requirements, loyalty and gentle perseverance set her apart.”
-- Bill and Carol Seidel
Marilyn Garcia, PhD Broker Associate, Realtor® CA DRE LICENSE #01355514
The Grubb Company 1656 Shattuck Avenue Berkeley, CA 94709
Direct: (510) 390-5406